
Ethereum Breakout Confirmation Attracts Two Key Groups — Is the Price Heading to $5,100?

Ethereum price trades above $4,540 after confirming a falling wedge breakout. On-chain and derivatives data suggest strong support for the move, pointing toward $5,110 if conditions align.
Ethereum trades above $4,540 at press time on September 12, up nearly 3% in the past 24 hours. Weekly gains stand near 4.7%, while month-on-month changes remain muted at –1.9%. Still, the breakout that took place on September 10 has put the Ethereum price back in the spotlight.
The falling wedge breakout now in motion suggests room for further gains, with on-chain and derivatives data showing that two powerful groups are backing the move. Together, their actions point to a potential run toward $5,110 if conditions hold.
Spot Holders Step Back While Derivatives Traders Surge In
Ethereum’s rally has been marked by a sharp drop in the Spent Coins Age Band (SCAB). On September 4, coins moving across all age groups reached 417,000 ETH. By September 12, that figure had plunged to just 148,000 ETH (a 64.5% drop), even with a temporary spike to 365,000 ETH on September 11.
This drop or spot cooldown stands out because recent local ETH price highs, such as August 14 and August 27, saw spent coins jump above 500,000 ETH.
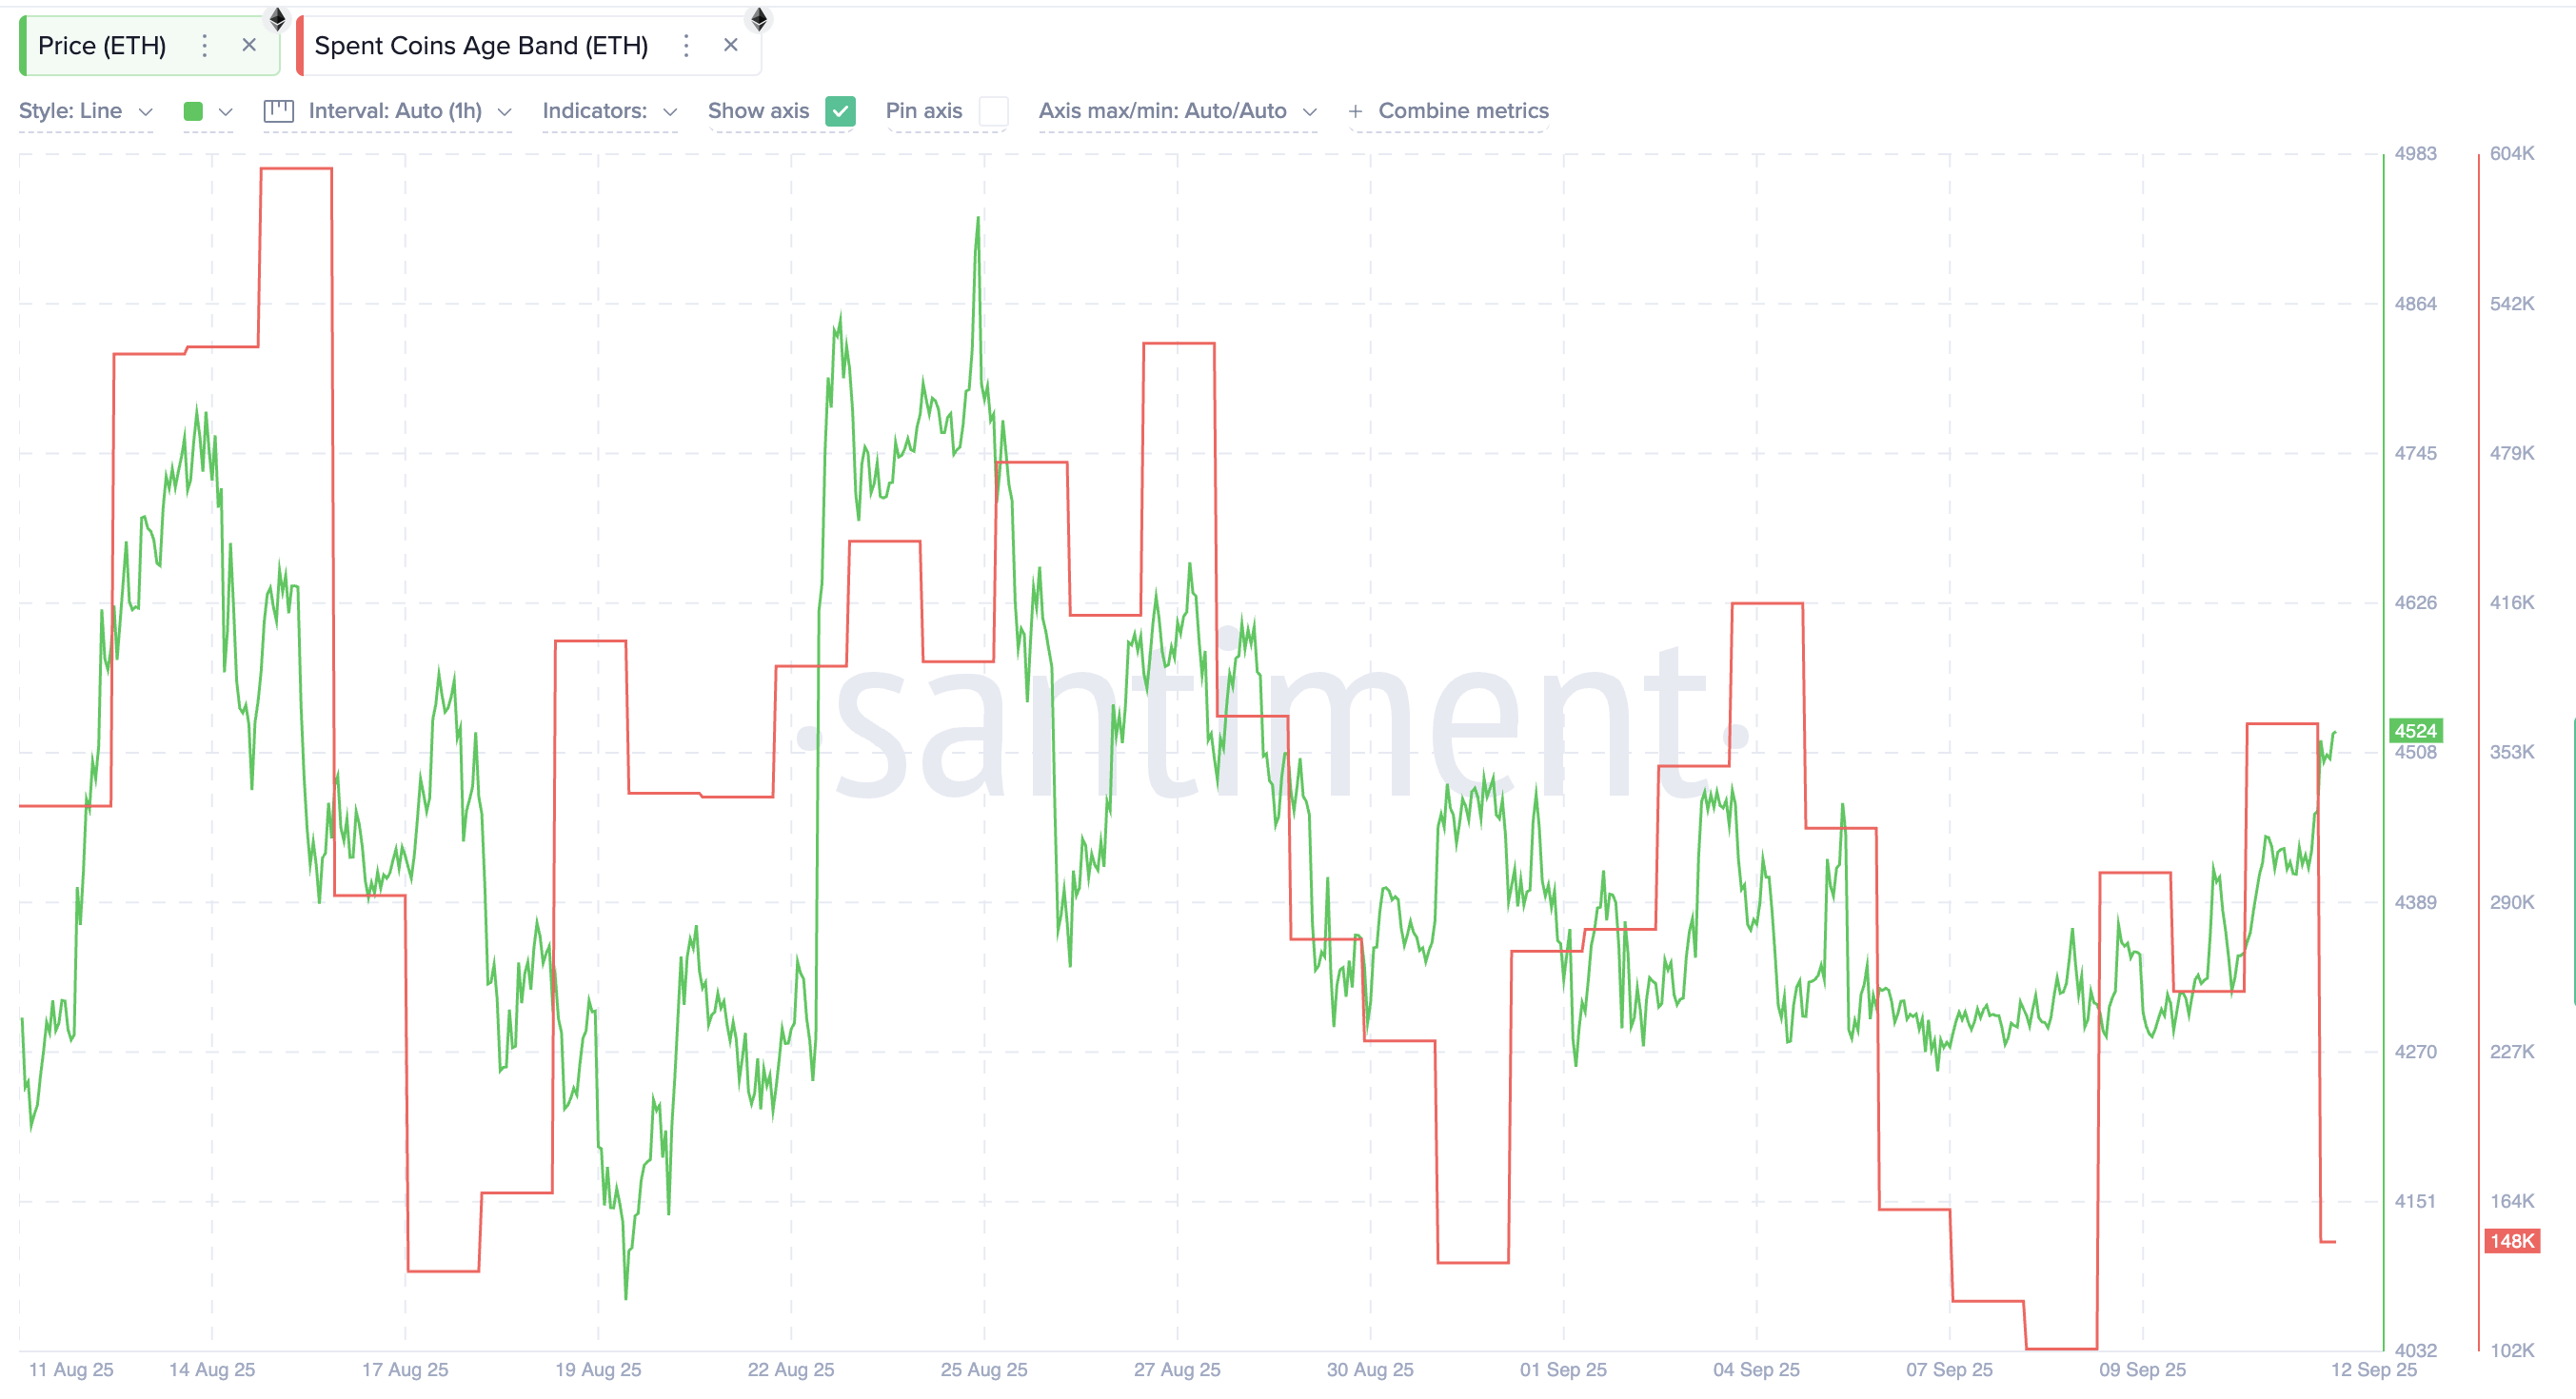 Ethereum Spot Market Cools Down:
In other words, rallies earlier in the summer saw heavy selling from older coins. Now, the opposite is happening. The decline in spent coins shows that holders — even those with long-held ETH — are not selling into the rally. This adds conviction to the breakout, since fewer coins are hitting the market.
The Spent Coins Age Band (SCAB) metric tracks the distribution of coins being moved by age. It reveals whether old supply is pressuring the market or staying quiet.
At the same time, derivatives activity has surged. The Taker Buy/Sell Ratio has climbed above 1.0, signaling that buyers are dominating order books by absorbing sell orders. The ratio began rising on September 10, just as Ethereum broke out of its falling wedge (which we will discuss later in the piece), and peaked at 1.17, the highest level in over a year.
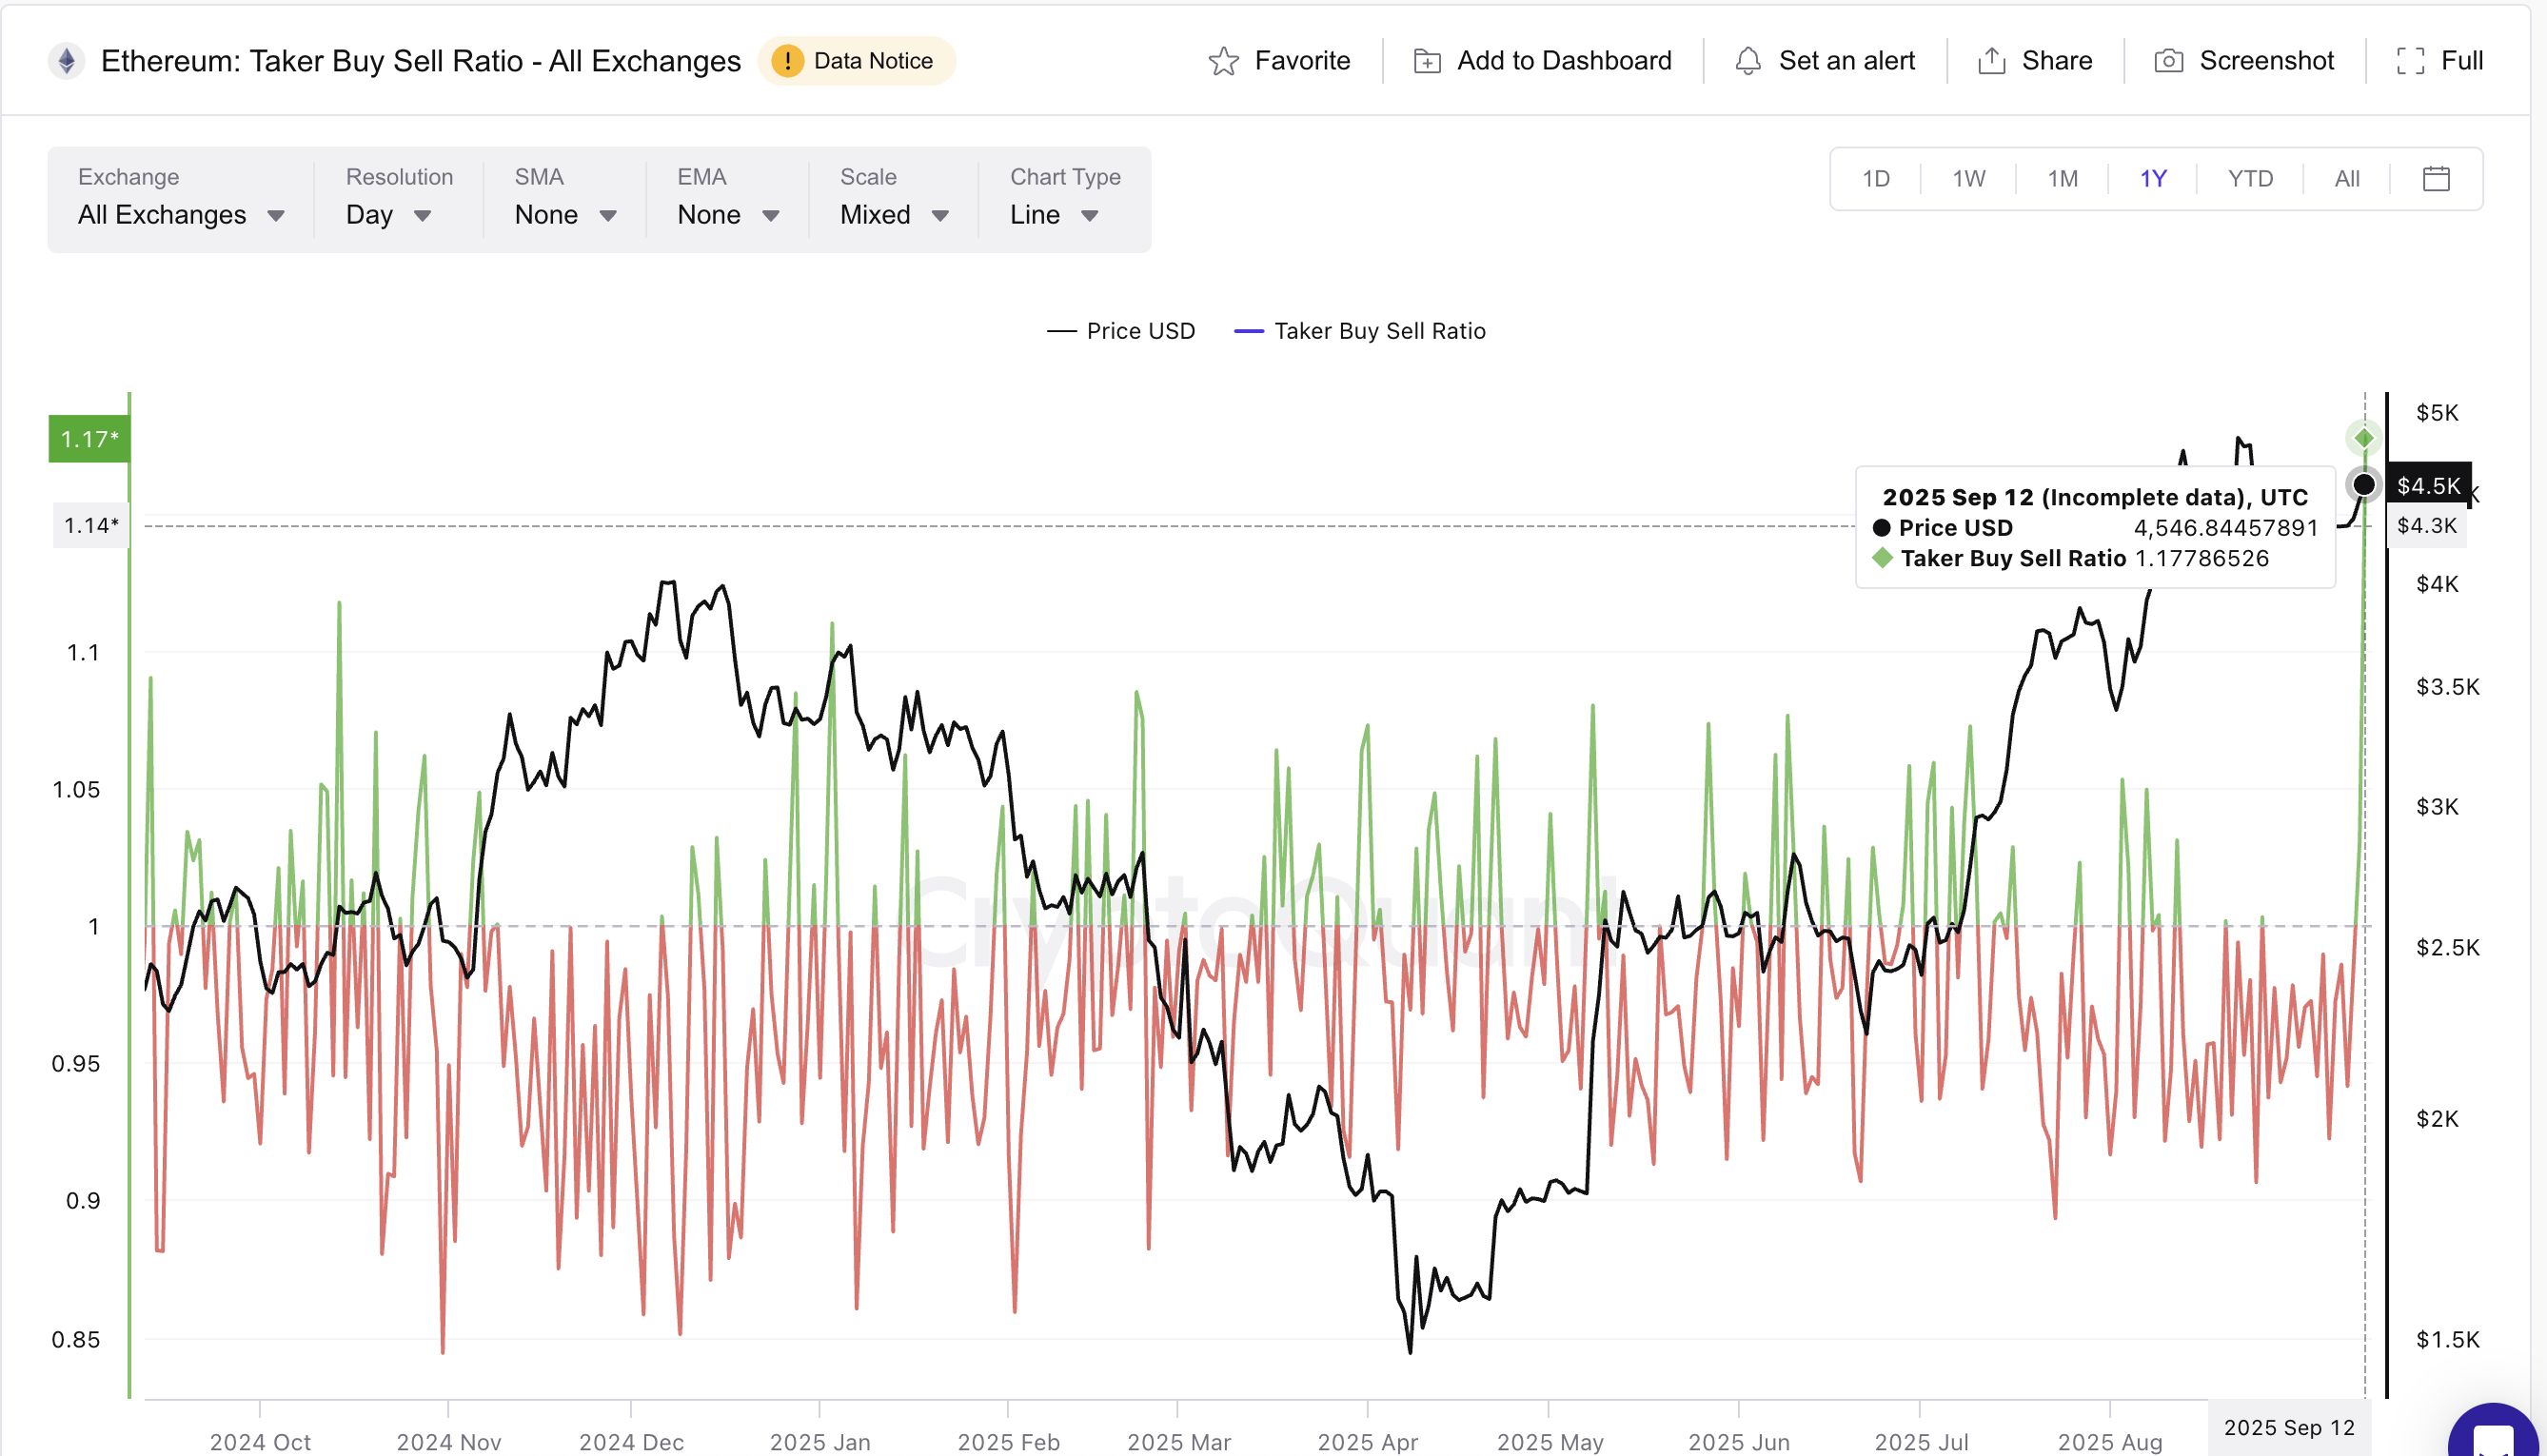 Ethereum Derivatives Traders Bet Long:
Such peaks typically show aggressive buying pressure. For context, one of the last major spikes occurred on August 3, when the ratio jumped and Ethereum rallied from $3,490 to $4,750, a near 36% surge. While these surges often cool down later in the day, the current reading underlines strong speculative demand from derivatives traders.
The combination is powerful: spot holders are showing conviction by not selling, and derivatives traders are piling in with bullish bets. These two cohorts together give Ethereum’s breakout a supportive foundation.
Falling Wedge Breakout Points Toward $5,100 for the Ethereum Price
Ethereum’s technical structure also supports this bullish setup. On September 10, ETH confirmed a breakout from a falling wedge — a pattern where prices form lower highs and lower lows inside narrowing lines, eventually breaking upward.
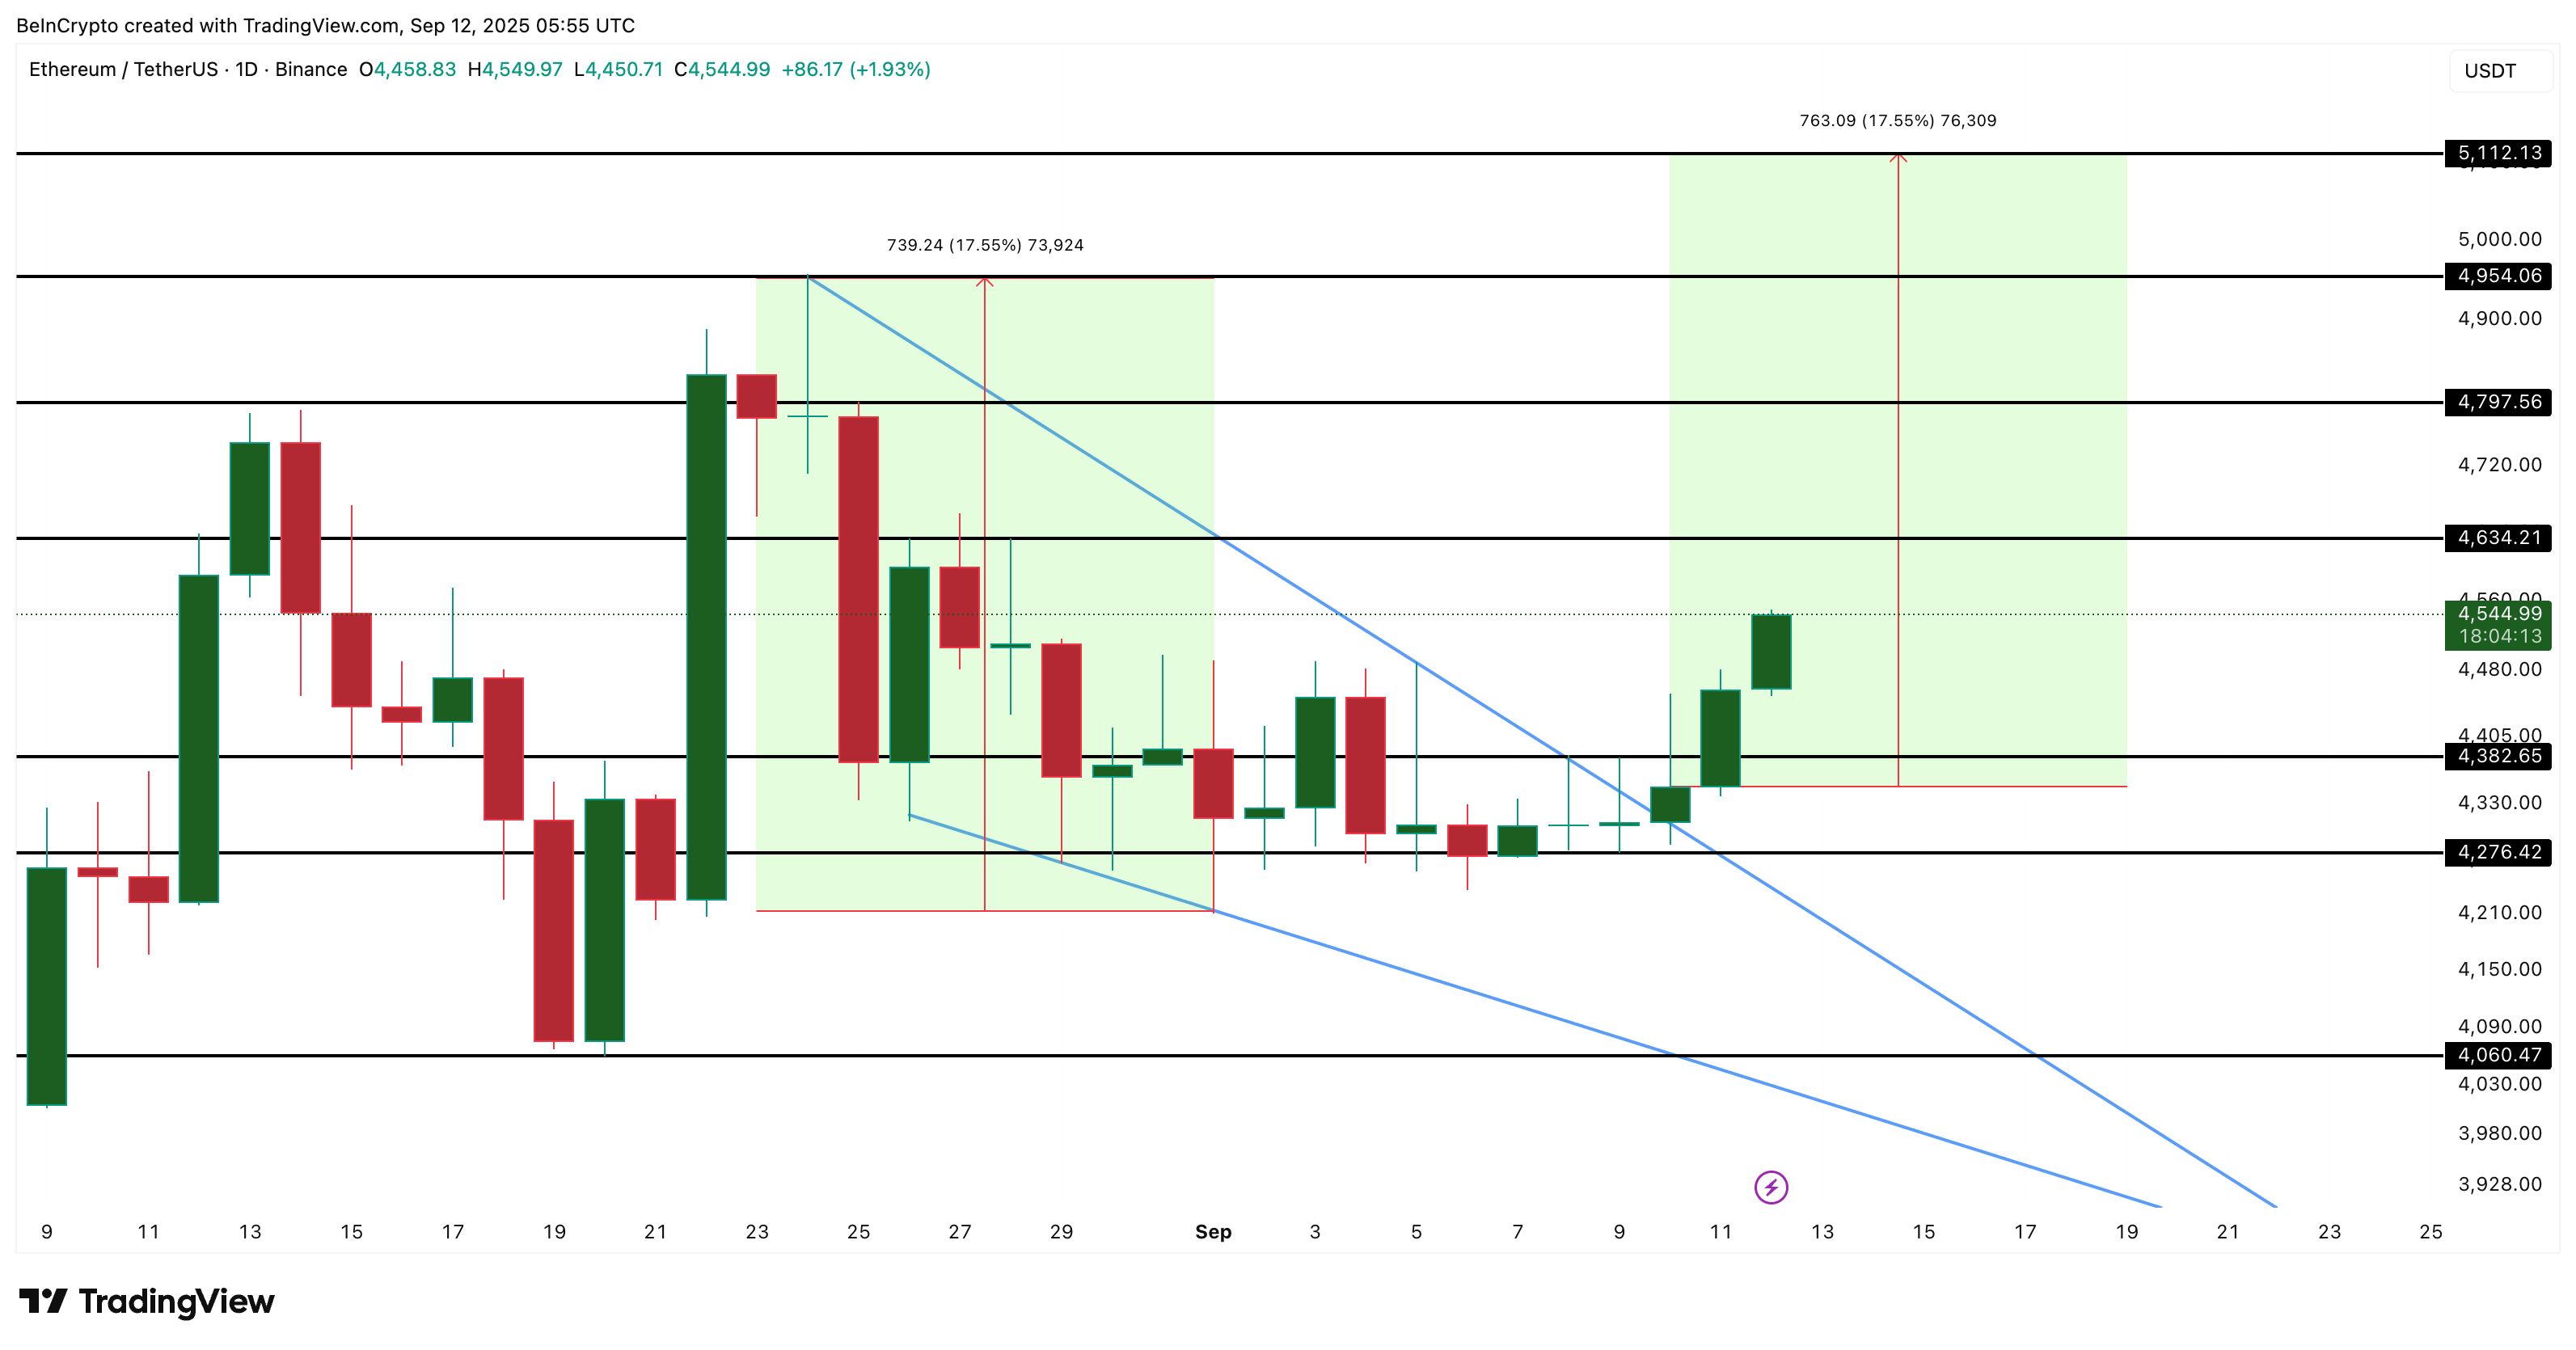 Ethereum Price Analysis:
The target for this move is measured by taking the vertical distance between the wedge’s highest and lowest points. That distance is then projected from the breakout level. That gives a target of above $5,110, or nearly 12% higher than current levels, if market conditions allow.
Before that, the Ethereum price must clear several resistance levels. The first sits at $4,630, followed by $4,790 and the prior Ethereum price peak of almost $4,950.
On the downside, $4,380 is immediate support. Yet, a drop under $4,279 would invalidate the falling wedge breakout entirely and return ETH to a neutral outlook. And things get bearish if the price falls under $4,060, something that doesn’t look likely in the near-term.
Disclaimer: The content of this article solely reflects the author's opinion and does not represent the platform in any capacity. This article is not intended to serve as a reference for making investment decisions.
You may also like
Tech Stocks Plunge, Safe-Haven U.S. Treasury Trades Return? 10-Year U.S. Treasury Yield Drops to Three-Week Low
If AI capital expenditure slows down, a sudden halt in computing power construction will severely impact the supply chain while lowering market expectations for demand in electricity, commodities, and high-end hardware. This not only leads to a correction of overvalued assets, but also undermines growth expectations and inflation premiums, ultimately benefiting bonds. This logic is highly similar to the macroeconomic landscape during the bursting of the internet bubble in 2000, when the Nasdaq collapsed and the yield on 10-year US Treasury bonds dropped from a high of 6.5% to the 4% range.
BlackRock (BLK.US) Q3 Conference Call: Huge Financing Demand for AI Infrastructure, Computing Power May Become a New Asset Class
BlackRock (BLK.US) will release its third-quarter 2026 earnings before the US stock market opens on October 14, followed by a conference call.

Litecoin falls 2% to $59.90 as traders watch key $59 support zone
Approaching the "Death Cross"! Korean stocks hit "Black Thursday", KOSPI continuously falls below the 200-day moving average, is a prolonged bear market coming?
Hit hard by rising US inflation and concerns over AI profitability, Korean stocks plummeted 7.57% in a single day on October 15, with two major indices triggering circuit breakers for the first time in two and a half months. Foreign investors have cumulatively sold over 16 trillion won ($12 billion) in eight days. Technical indicators are flashing warnings: the KOSPI has fallen more than 8% below its 200-day moving average, and if it cannot recover within two weeks, the probability of a prolonged bear market is as high as 43%; a "death cross" is expected to form after 16 trading days. The Q3 earnings season will serve as the final validation point.

Crypto prices
More


