
DOGE Holders Refuse to Sell as Rally Heats Up— Is a 2025 High in Sight?

DOGE eyes $0.33 as hodlers accumulate, but overbought signals suggest a possible short-term correction.
Leading meme coin Dogecoin (DOGE) has surged 21% over the past week, riding on improvements in broader market sentiment and renewed investor confidence.
On-chain data reveals a consistent pattern of hodling among long-term investors. This behavior signals conviction and hints at the likelihood of a sustained uptrend.
Dogecoin Holders Lock In
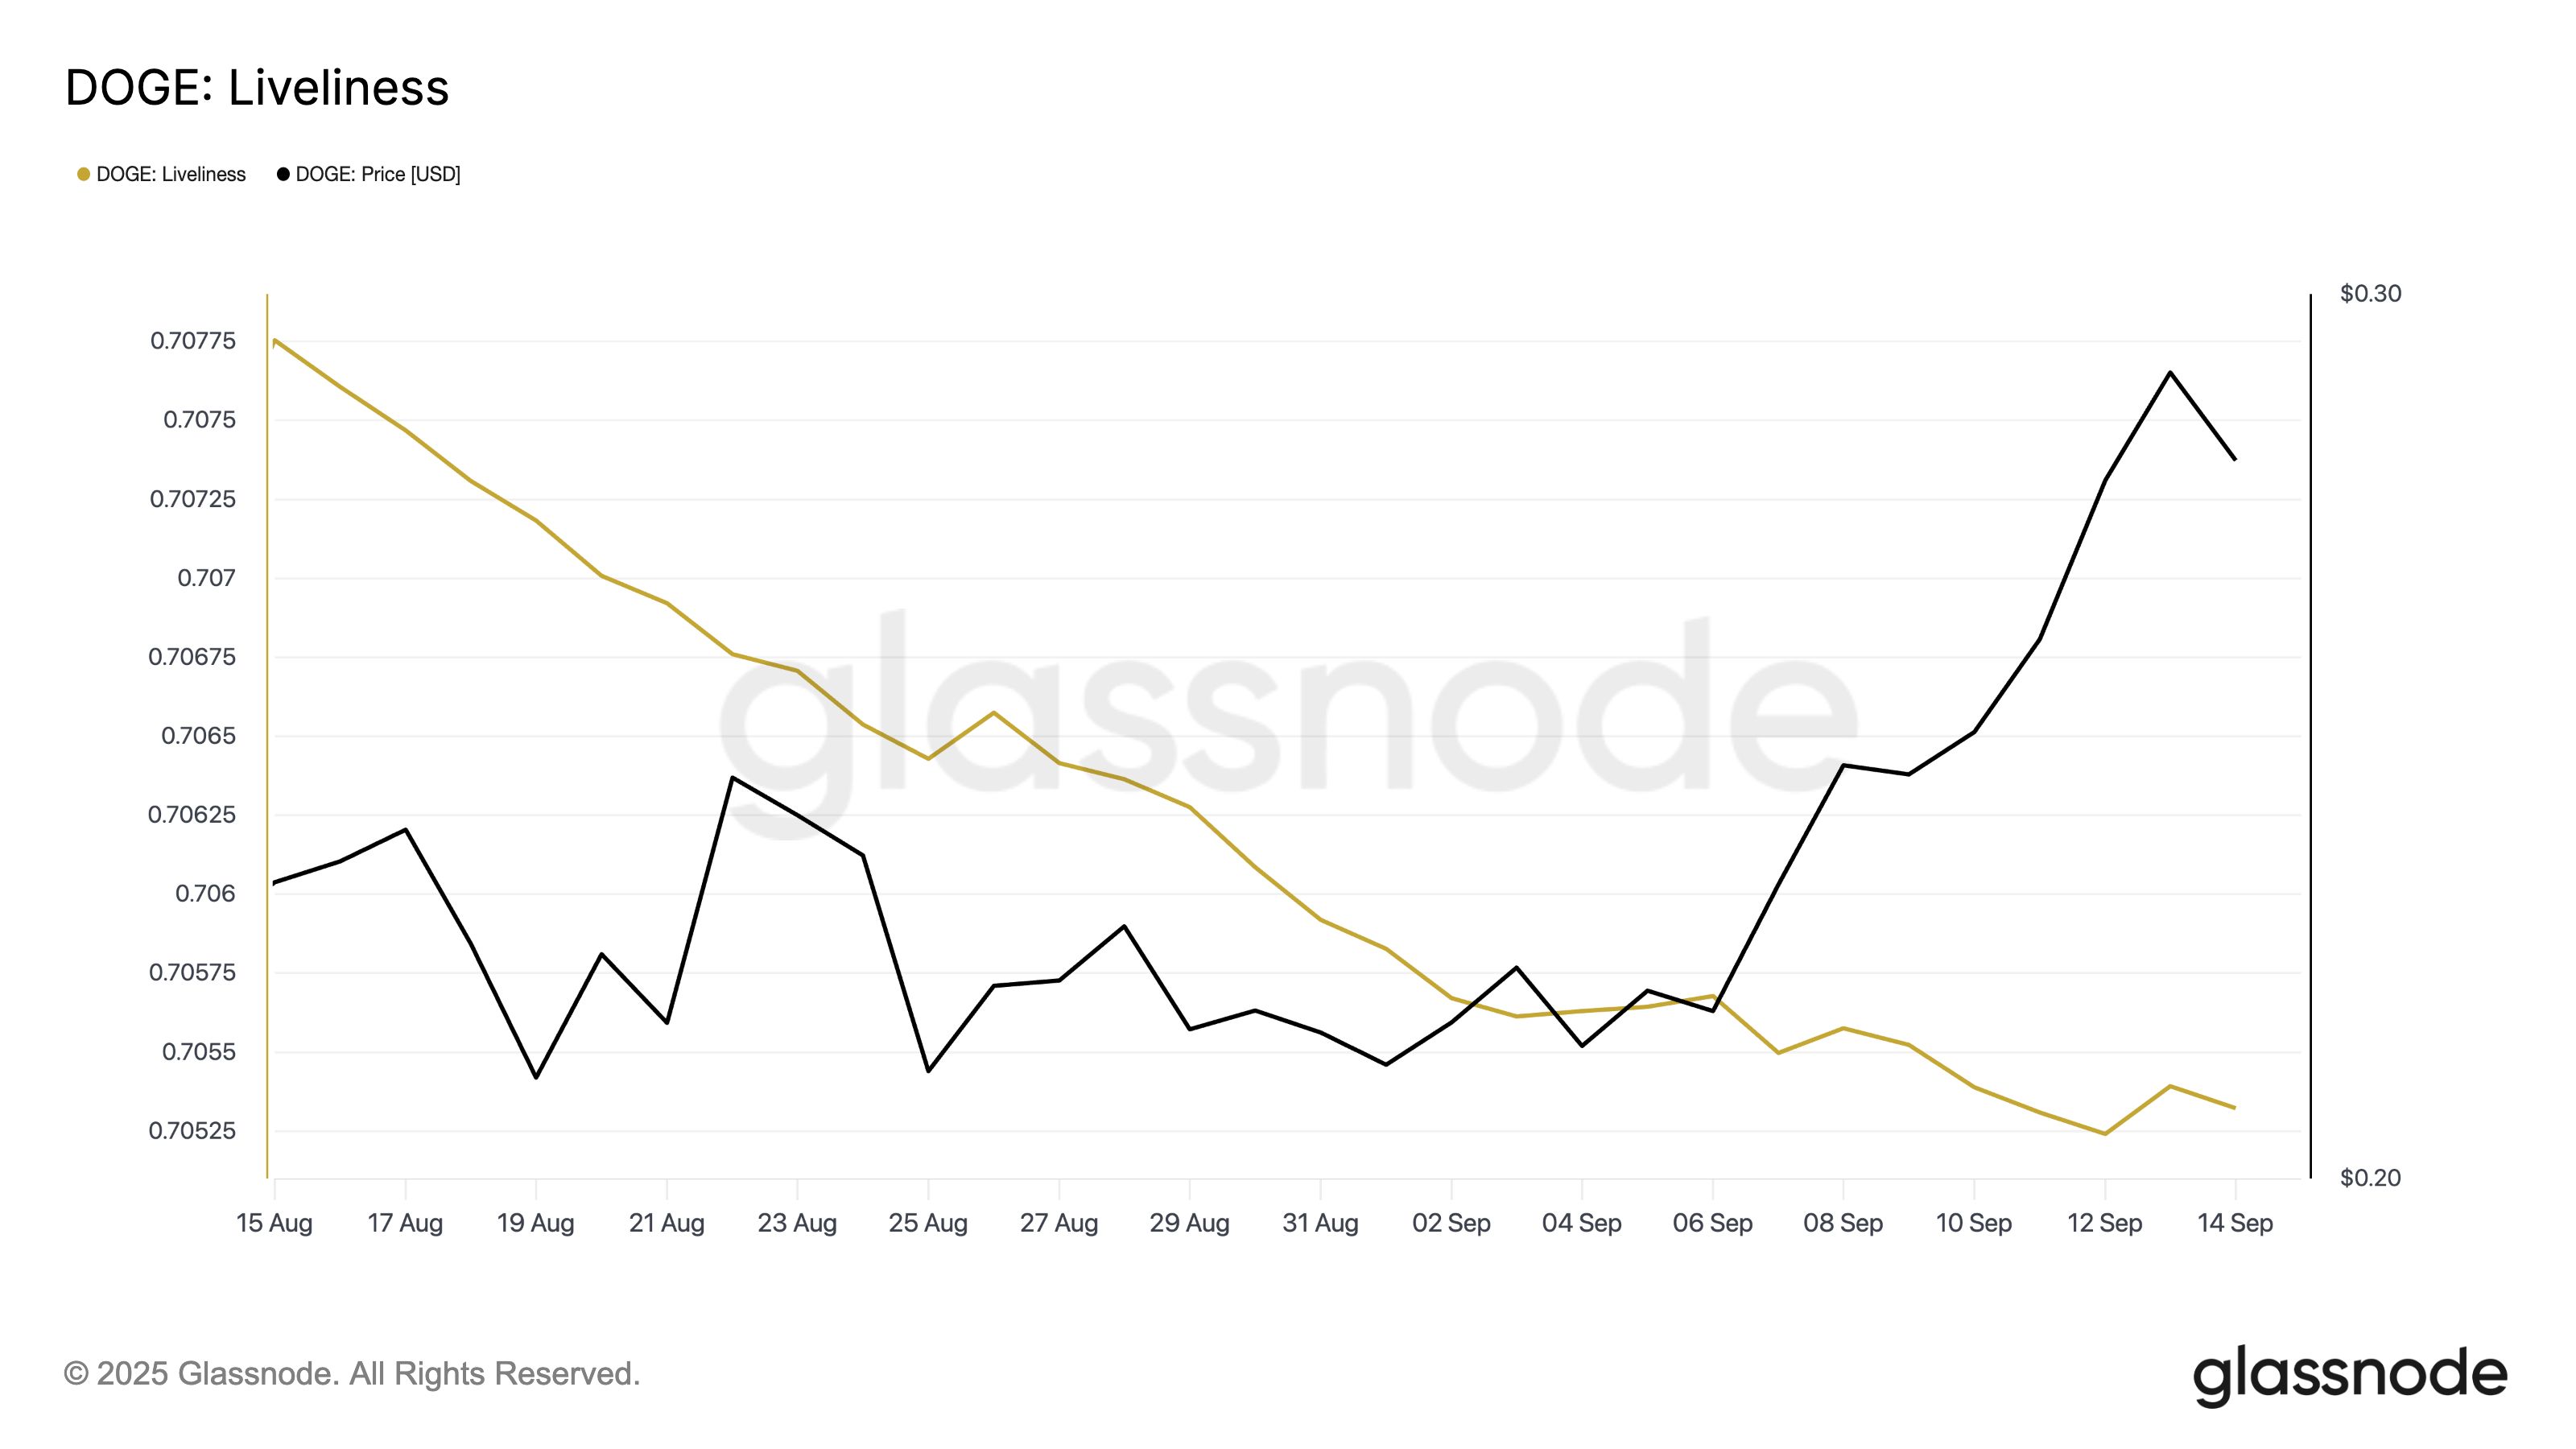
One key metric highlighting this renewed optimism is the coin’s liveliness, which measures the extent to which long-term holders (LTHs) are spending their coins.
According to Glassnode, DOGE’s liveliness has plunged steadily over the past month. The move points to a sharp slowdown in selloffs among these investors. As of this writing, the metric is 0.705, suggesting that many long-held DOGE have become dormant.
For token TA and market updates: Want more token insights like this? Sign up for Editor Harsh Notariya’s Daily Crypto Newsletter .
 Dogecoin Liveliness. Source:
Glassnode
Dogecoin Liveliness. Source:
Glassnode
This supports the narrative of a conviction-led holding, which could help DOGE record more gains in the short term.
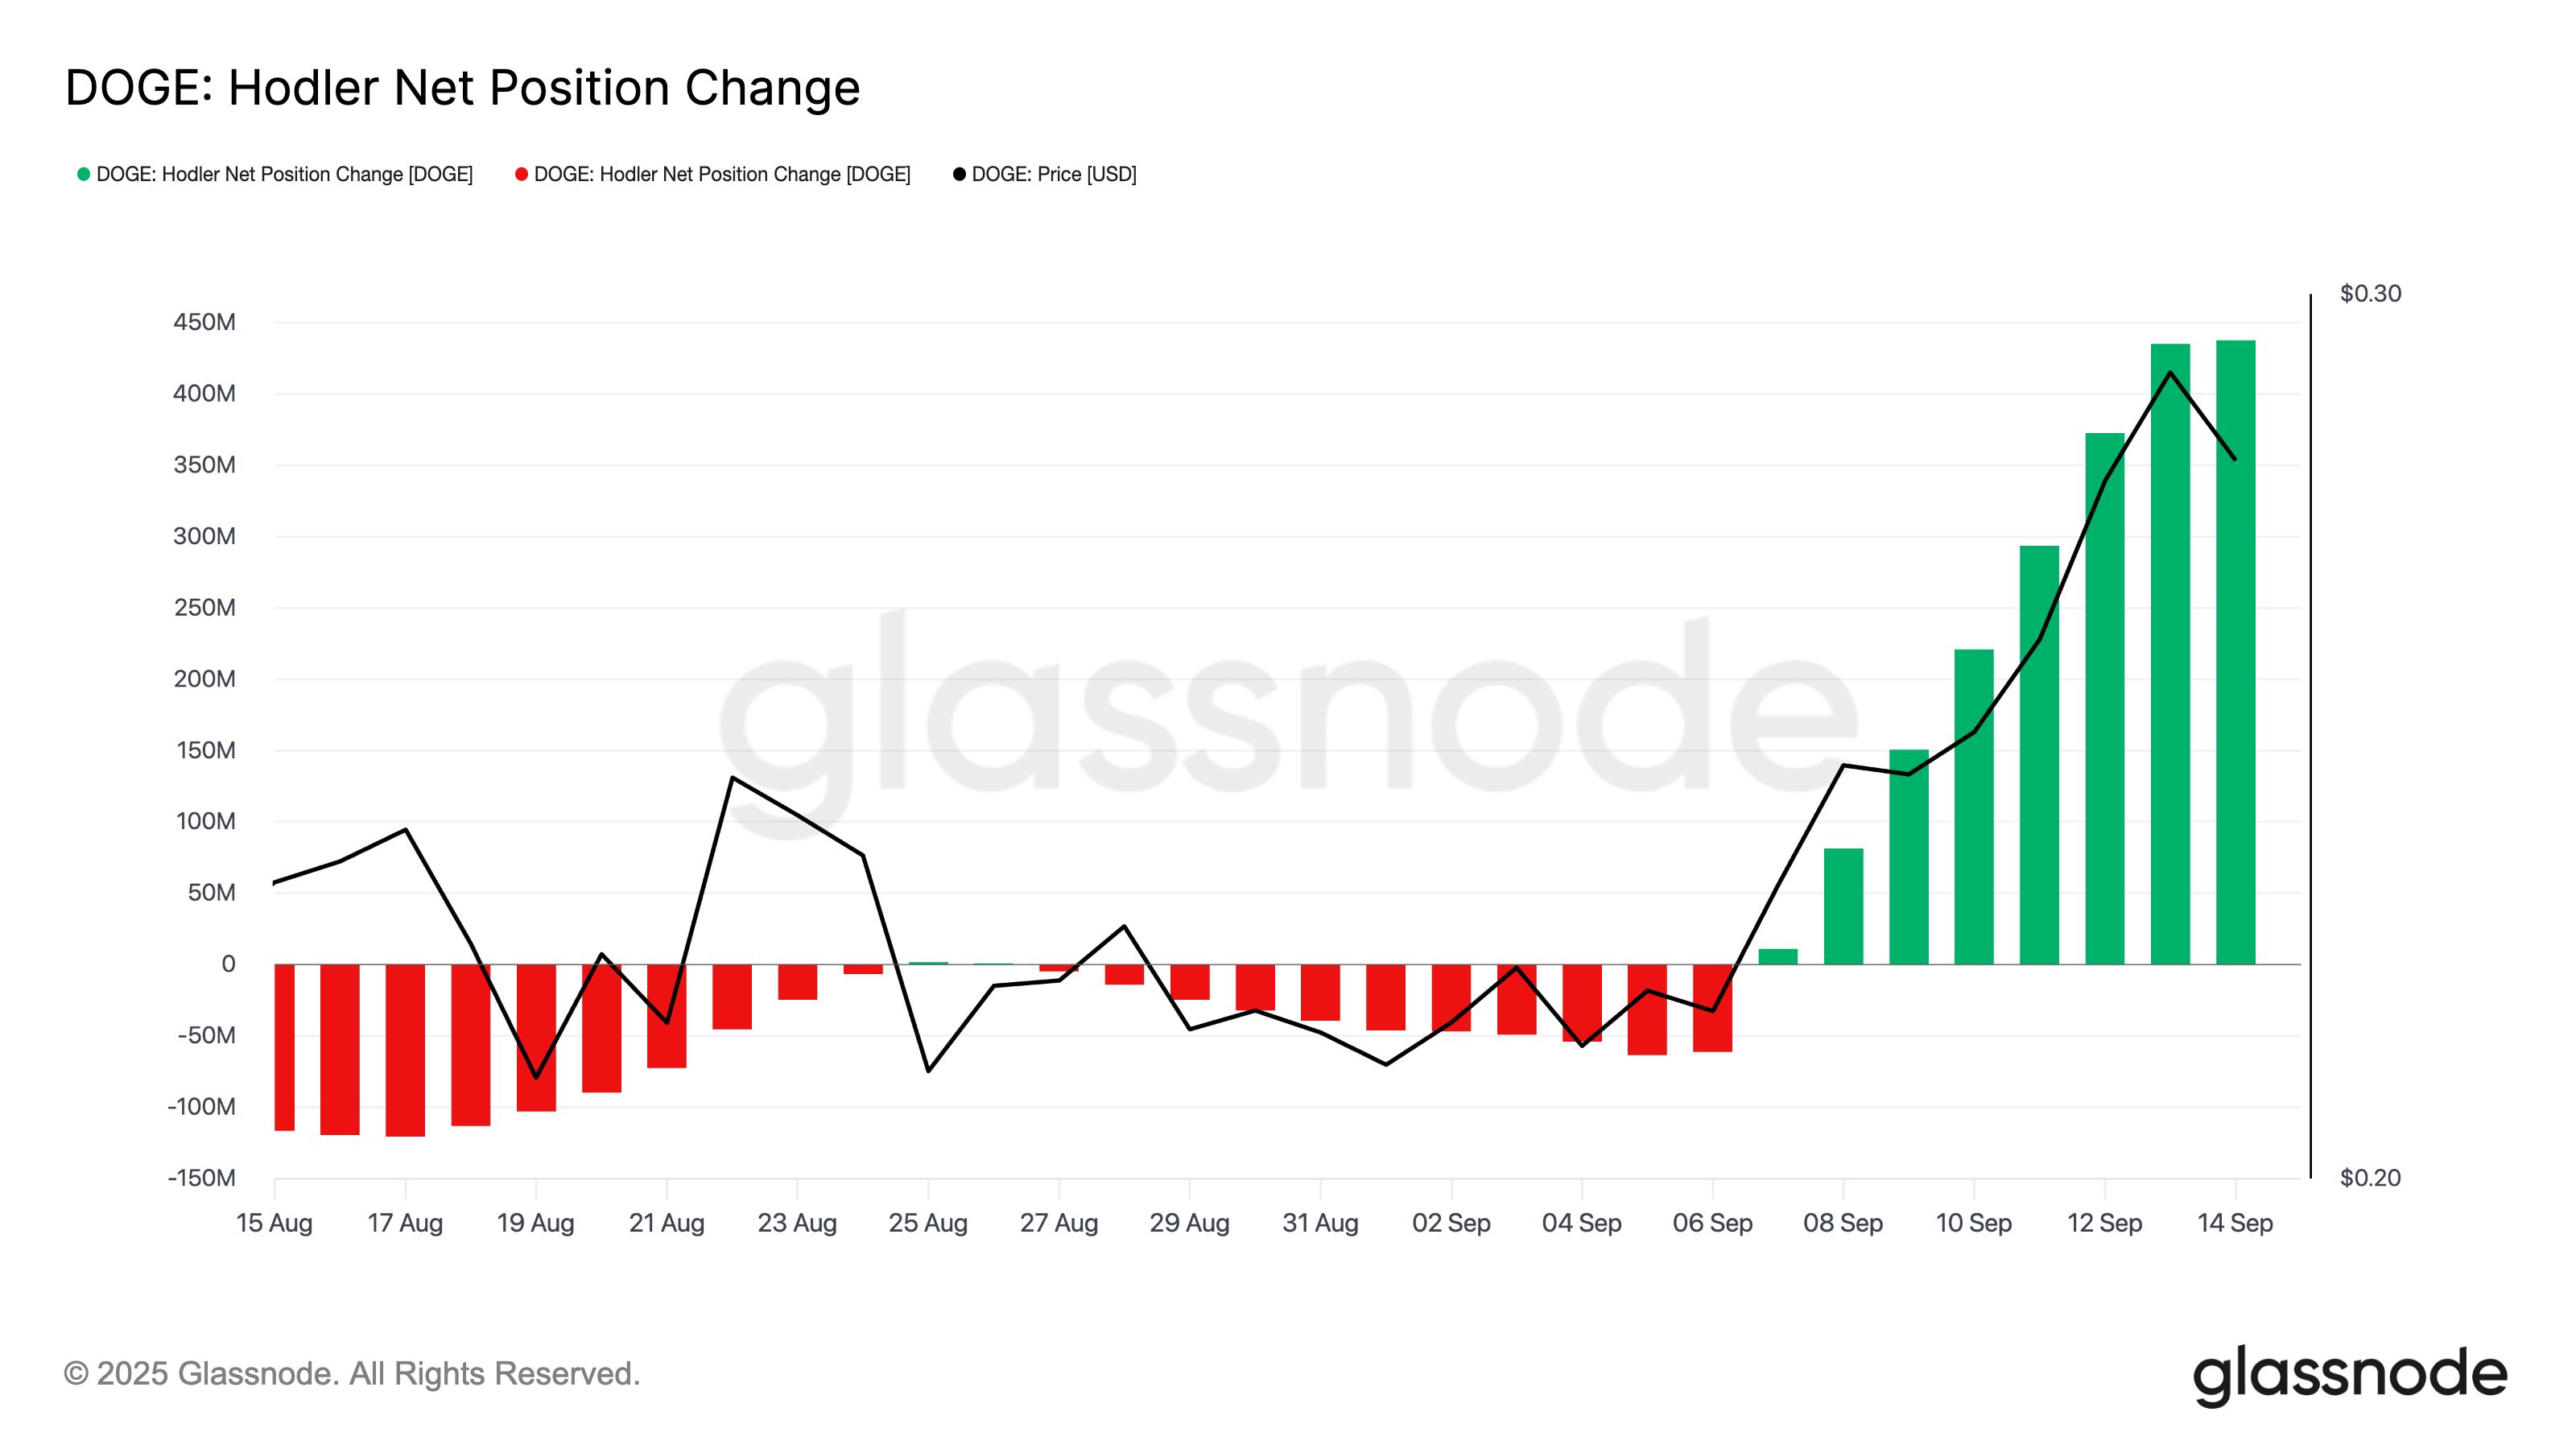
Moreover, DOGE’s Hodler Net Position Change has recorded a steady uptick since September 7. Thus, confirming that more coins are being moved into long-term storage.
 Dogecoin Hodler Net Position Change. Source:
Glassnode
Dogecoin Hodler Net Position Change. Source:
Glassnode
According to Glassnode, this metric tracks the net position of long-term holders over a given period, measuring whether investors are increasing or reducing their exposure. A positive reading indicates that more coins are being transferred into hodler wallets.
For DOGE, this is a bullish trend, as it reduces the available supply in circulation and reflects a vote of confidence from committed investors.
Can Holders Push Past $0.29 Before a Pullback?
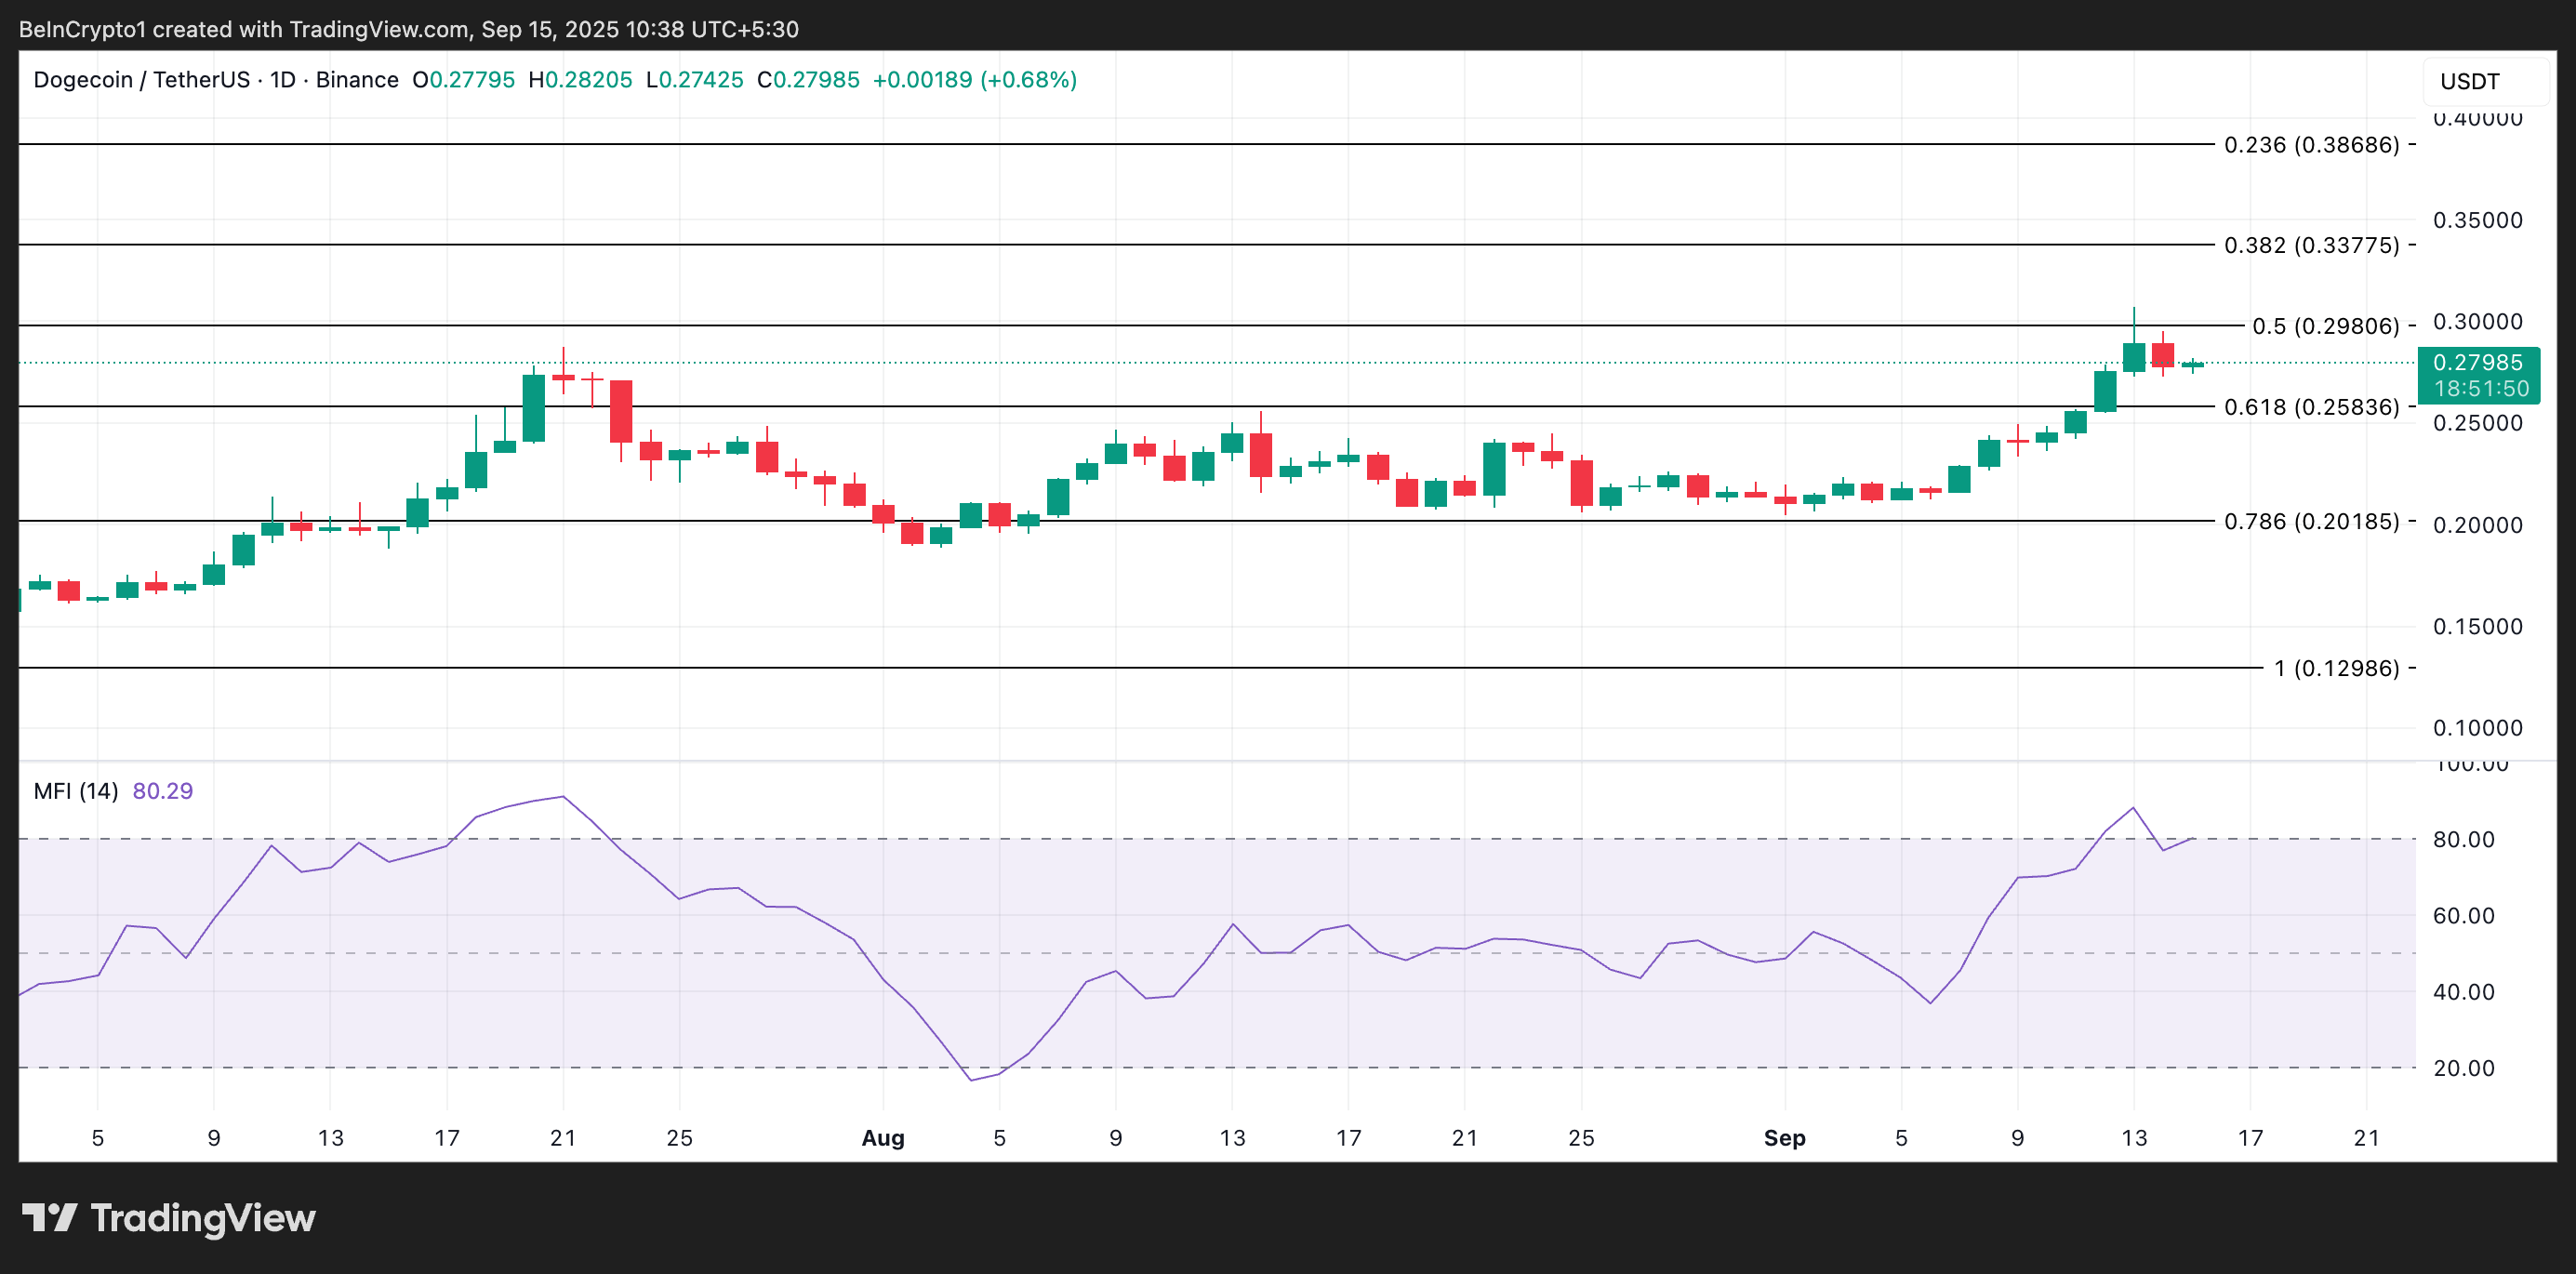
This wave of accumulation strengthens the case for continued upside momentum. If the trend persists, it could propel DOGE past the resistance at $0.29 and toward $0.33, a high it last reached in January.
However, daily chart readings from DOGE’s Money Flow Index (MFI) show the momentum indicator hovering around the overbought zone. This signals a potential pullback. As of this writing, the indicator, which measures buying and selling pressure by combining price and trading volume, is at 80.29.
Typically, the MFI ranges between 0 and 100, with values above 80 considered overbought and readings below 20 signaling oversold conditions.
When the indicator pushes into the overbought zone, as DOGE currently has, it suggests that buying pressure may be peaking and a short-term correction or price consolidation could follow.
 Dogecoin Price Analysis. Source:
TradingView
Dogecoin Price Analysis. Source:
TradingView
If this plays out, DOGE risks plummeting below $0.2583.
Disclaimer: The content of this article solely reflects the author's opinion and does not represent the platform in any capacity. This article is not intended to serve as a reference for making investment decisions.
You may also like
Wall Street Stands Guard as Bessent Strikes Again: Aftereffects of August's "Treasury Turnaround" Persist, November Refinancing Notice Could Be the Next Flashpoint
As the US Treasury prepares to update its debt management plan in November, key clues may emerge on Friday.
"Coca-Cola belief" never goes out of style! KFC in America says goodbye to Pepsi and embraces Coca-Cola (KO.US); Buffett-style "boring investment" returns to the spotlight
KFC has chosen Coca-Cola as its soda supplier in the United States, abandoning its long-term partner Pepsi. As of the close of the U.S. stock market on Thursday, Coca-Cola's (KO.US) stock price reached a record high, defying the ongoing declines in global tech stocks, especially in the semiconductor and broad AI computing sectors.
AI financing concerns weigh heavily on chip stocks, global tech sector has lost over $1 trillion this week
Multiple pressures, including rising expectations of a Federal Reserve rate hike and increasing AI financing costs, have led to a massive sell-off in global tech stocks this week. The combined market value of the world's top 20 AI and semiconductor stocks has evaporated by more than $1 trillion, and the semiconductor ETF (SOXX) has recorded its longest losing streak in 11 years. On Thursday, SK Hynix continued to plunge by over 10% in a single day, while Nvidia, Samsung, and SoftBank were not spared.
Safe Haven Amid AI Crash! Major Pharmaceutical Stocks Approach Historic Highs
Amid concerns over AI capital expenditures, funds are seeking a "certainty premium." State Street Healthcare ETF reached a record high. Eli Lilly and AbbVie are both approaching their historical highest closing prices, while Gilead and Amgen have surged 7.7% and 7.2% respectively over the past five days. Eli Lilly continues to bet on the future through its GLP-1 dominance and 40 M&A deals totaling $20 billion. AbbVie's core drug Skyrizi has shown positive data for its new subcutaneous formulation, which is expected to extend its patent and drive additional sales.
Crypto prices
More


