
SOMI Chart Shows Smart Trading Indicators Pointing to $1.53 — Another Rally Next?

SOMI price hovers near $1.30, with smart money signals and hidden RSI divergence hinting at a rebound setup. A breakout above $1.53 could shift momentum into a full rally.
SOMI’s price trades near $1.30, up almost 5% in the past 24 hours and 10% over the week. But don’t let those short-term gains fool you. The token has been correcting and rebounding sharply within small windows.
Just yesterday, the Somnia price briefly crossed $1.53 before pulling back, yet it still shows daily gains. That kind of movement reflects persistent selling pressure, but on-chain signals and chart patterns are now flashing rebound signs — the kind that smart traders usually watch.
Smart Money and Bulls Keep Rebound Hypothesis Alive
On the 12-hour chart, the Smart Money Index (SMI), which tracks buying and selling by smart traders, has quietly made a higher high since September 13. This suggests that traders who focus on quick rebounds are re-entering.
Still, confirmation is needed: the SMI must climb from its current 1.19 toward 1.47, and ideally 1.71, to unlock a broader rally setup.
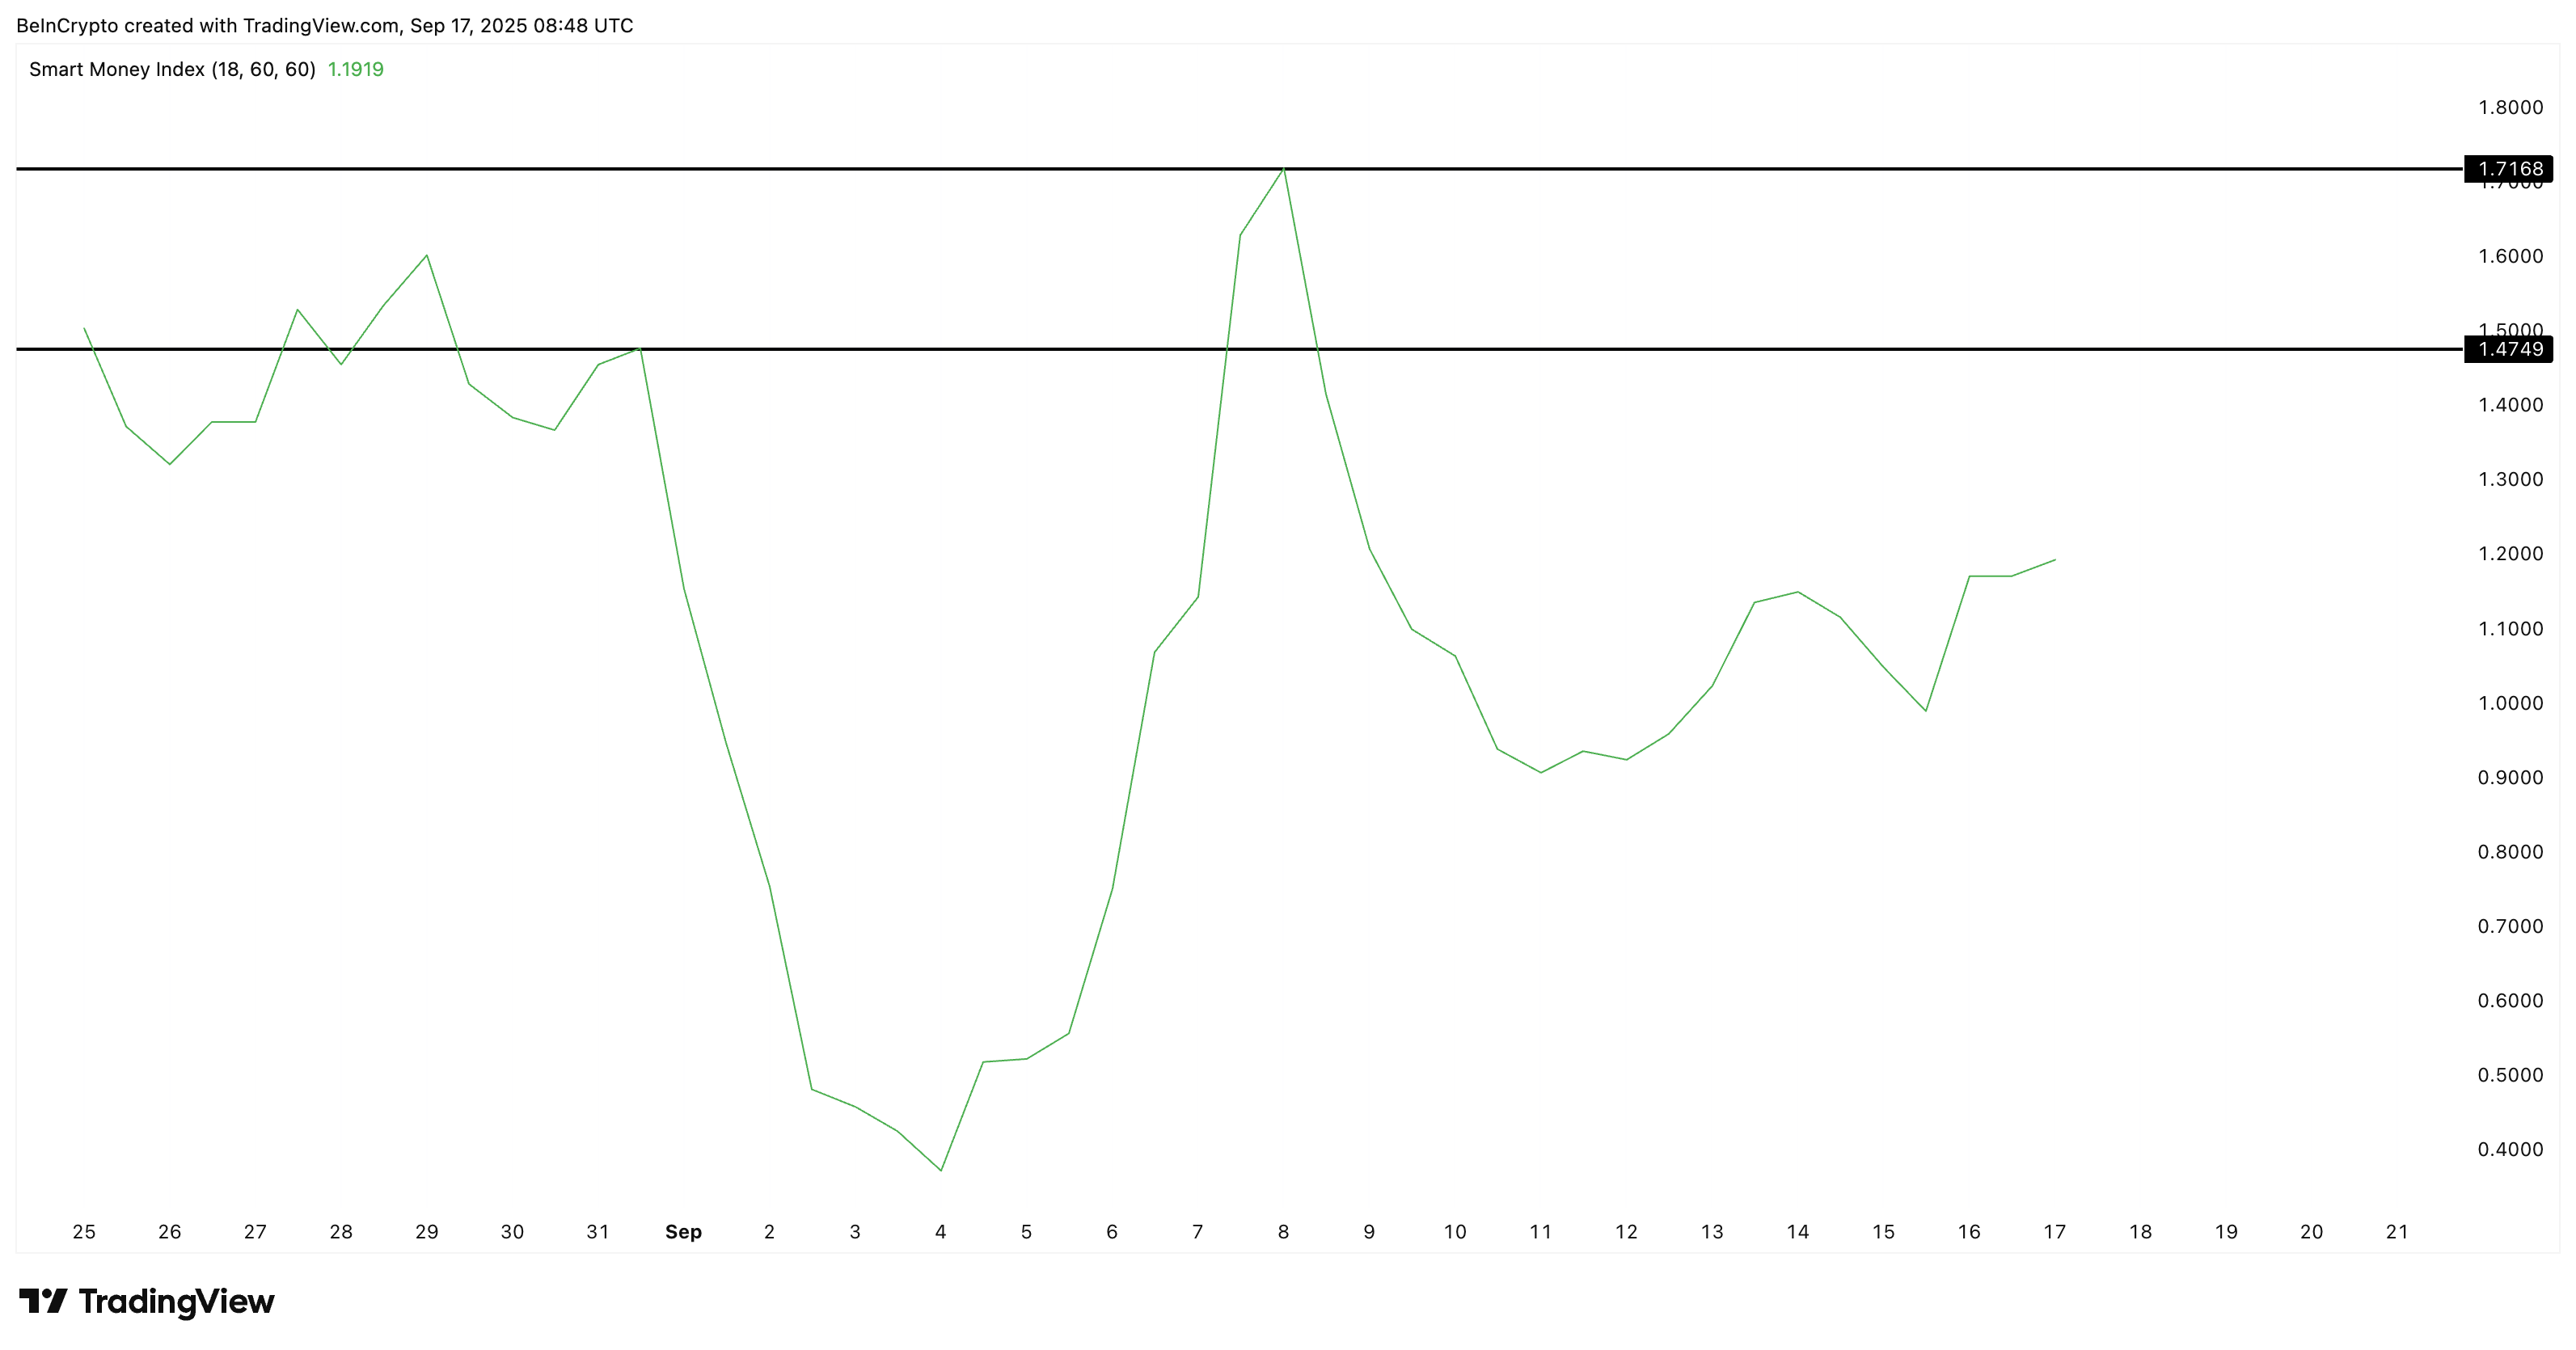 Smart Money Is Coming Back To Trade SOMI:
TradingView
Want more token insights like this? Sign up for Editor Harsh Notariya’s Daily Crypto Newsletter here.
At the same time, the Bull-Bear Power Indicator, which measures the balance between buying (bulls) and selling (bears), has stayed in the green.
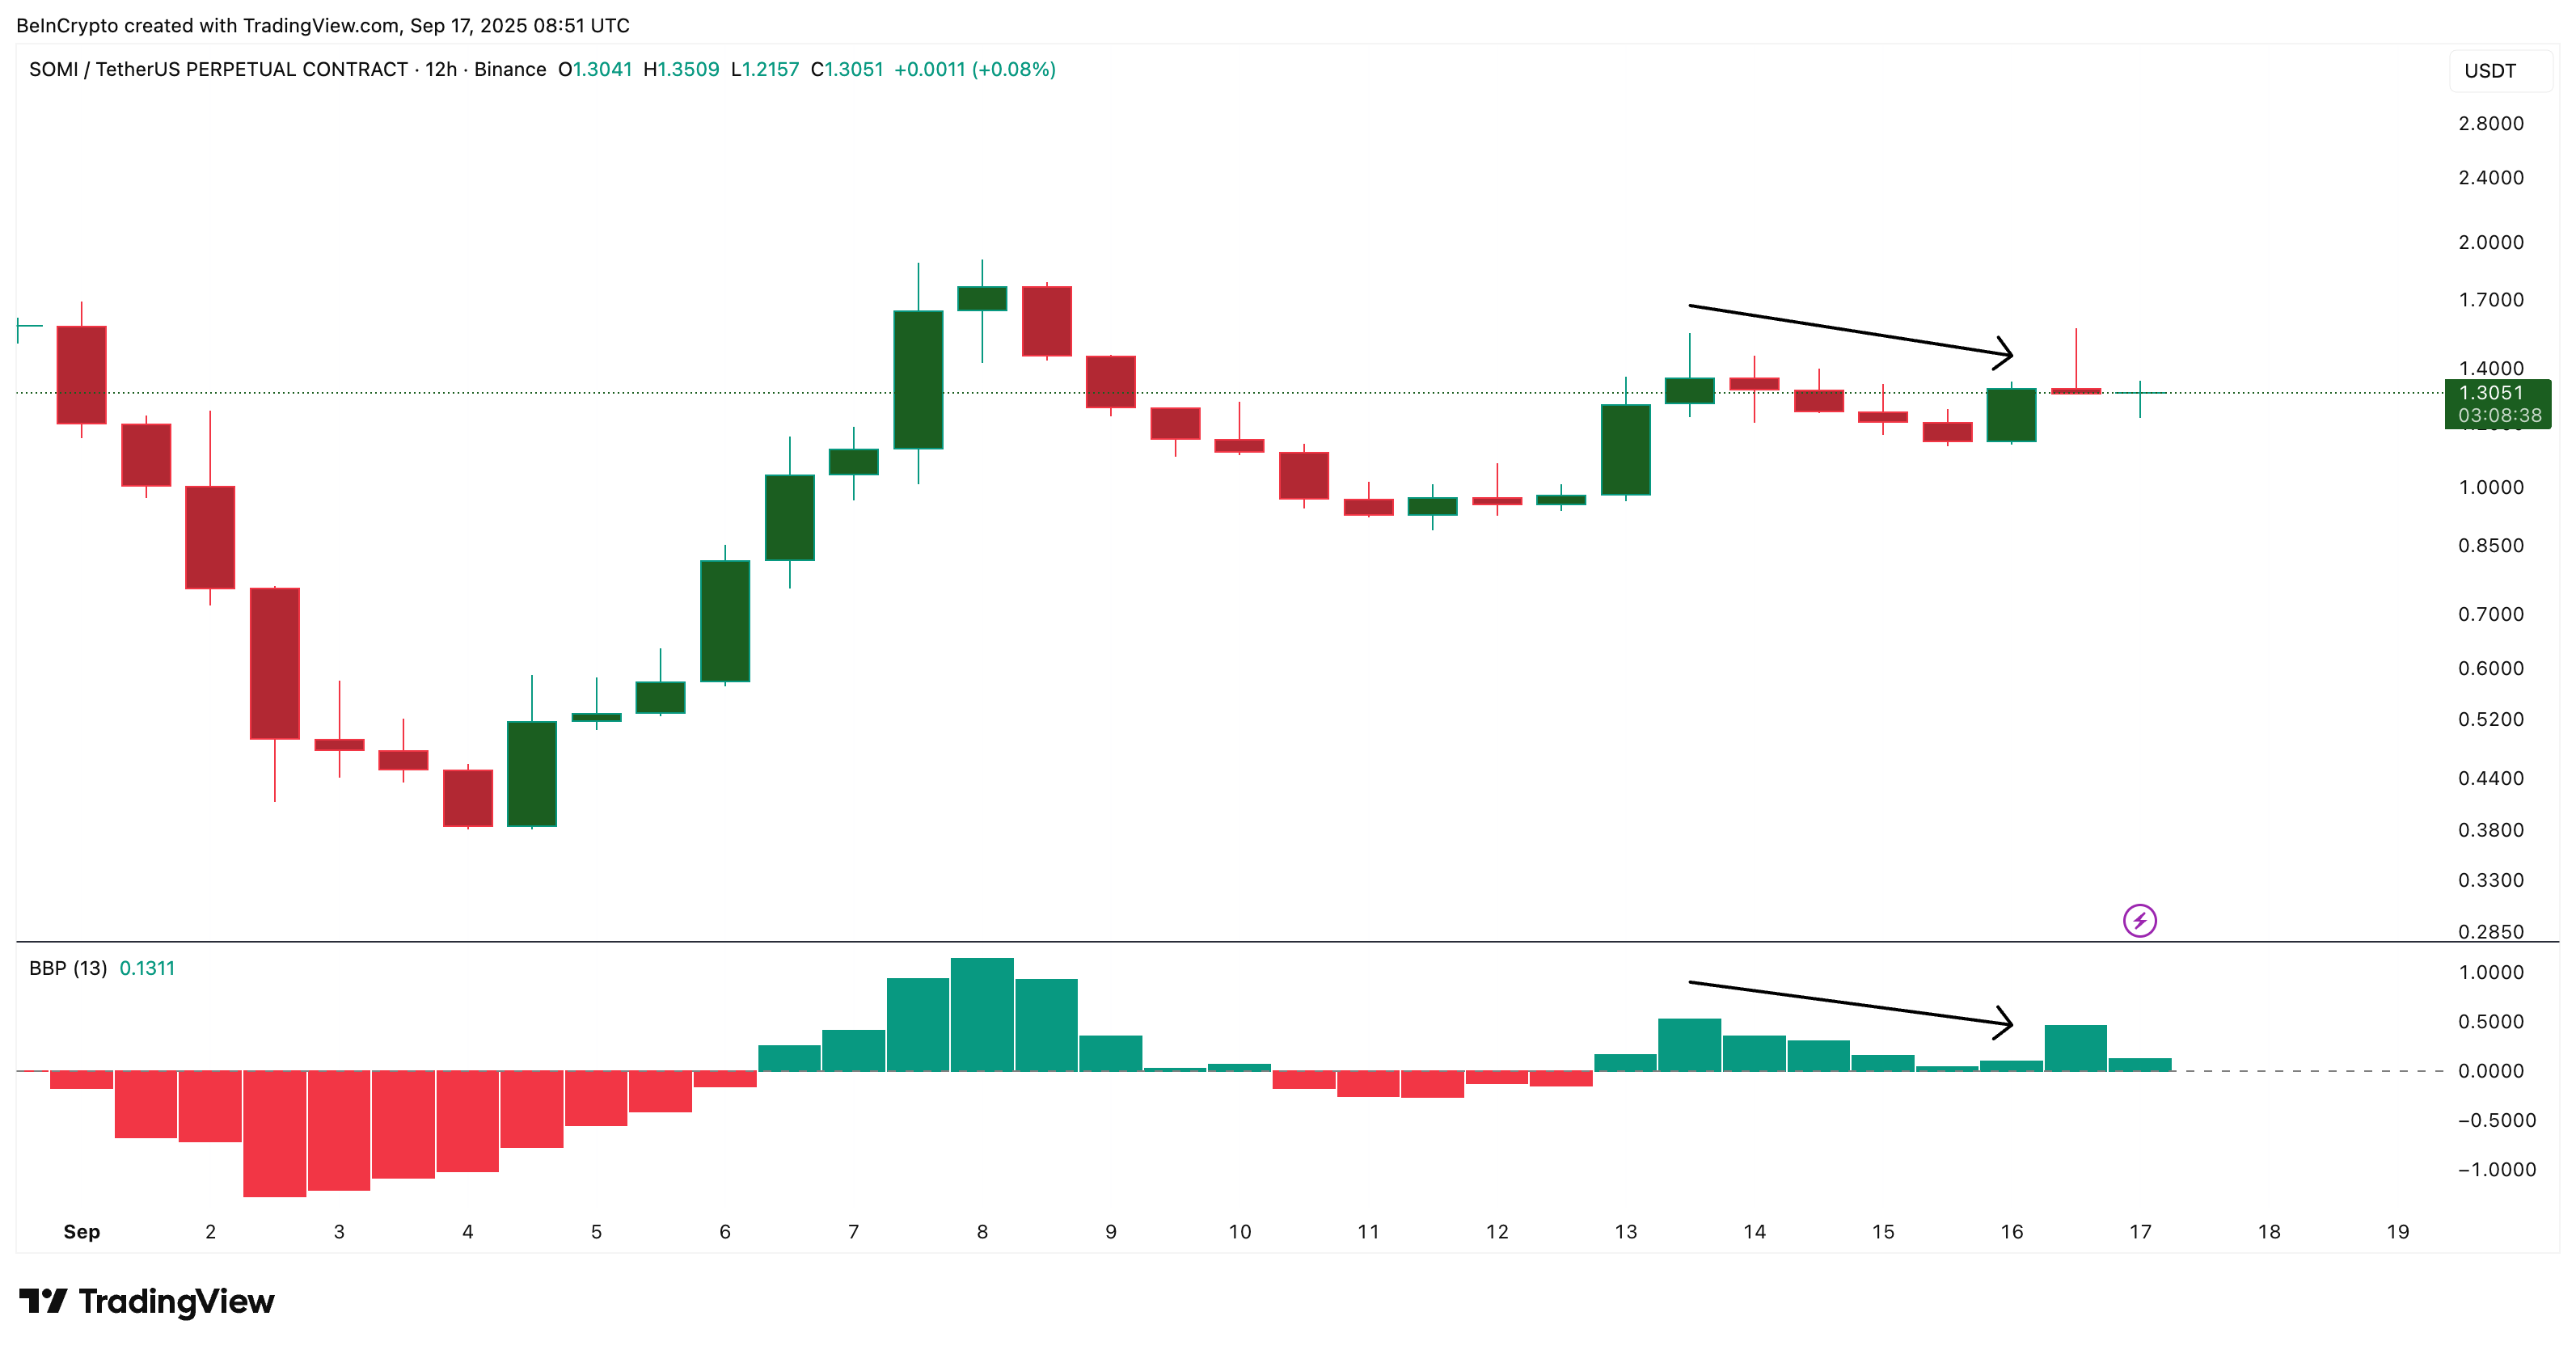 SOMI Bulls In Control:
TradingView
This means bulls have remained stronger than bears even during the September 10–16 SOMI price pullback. Bearish strength increased, but bulls never fully lost control.
Now, green bullish power candles are returning, showing that buyers are regaining momentum. This, along with the smart money index getting a move on, furthers the rebound narrative.
SOMI Price Action and Hidden Bullishness Strengthen the Case
The 4-hour chart offers clarity to capture the shorter-term moves. SOMI is trading inside an ascending triangle, a bullish structure that often signals the continuation of an uptrend.
The token has already broken past one resistance at $1.28, with the next checkpoints for the SOMI price rebound sitting at $1.35 and $1.45.
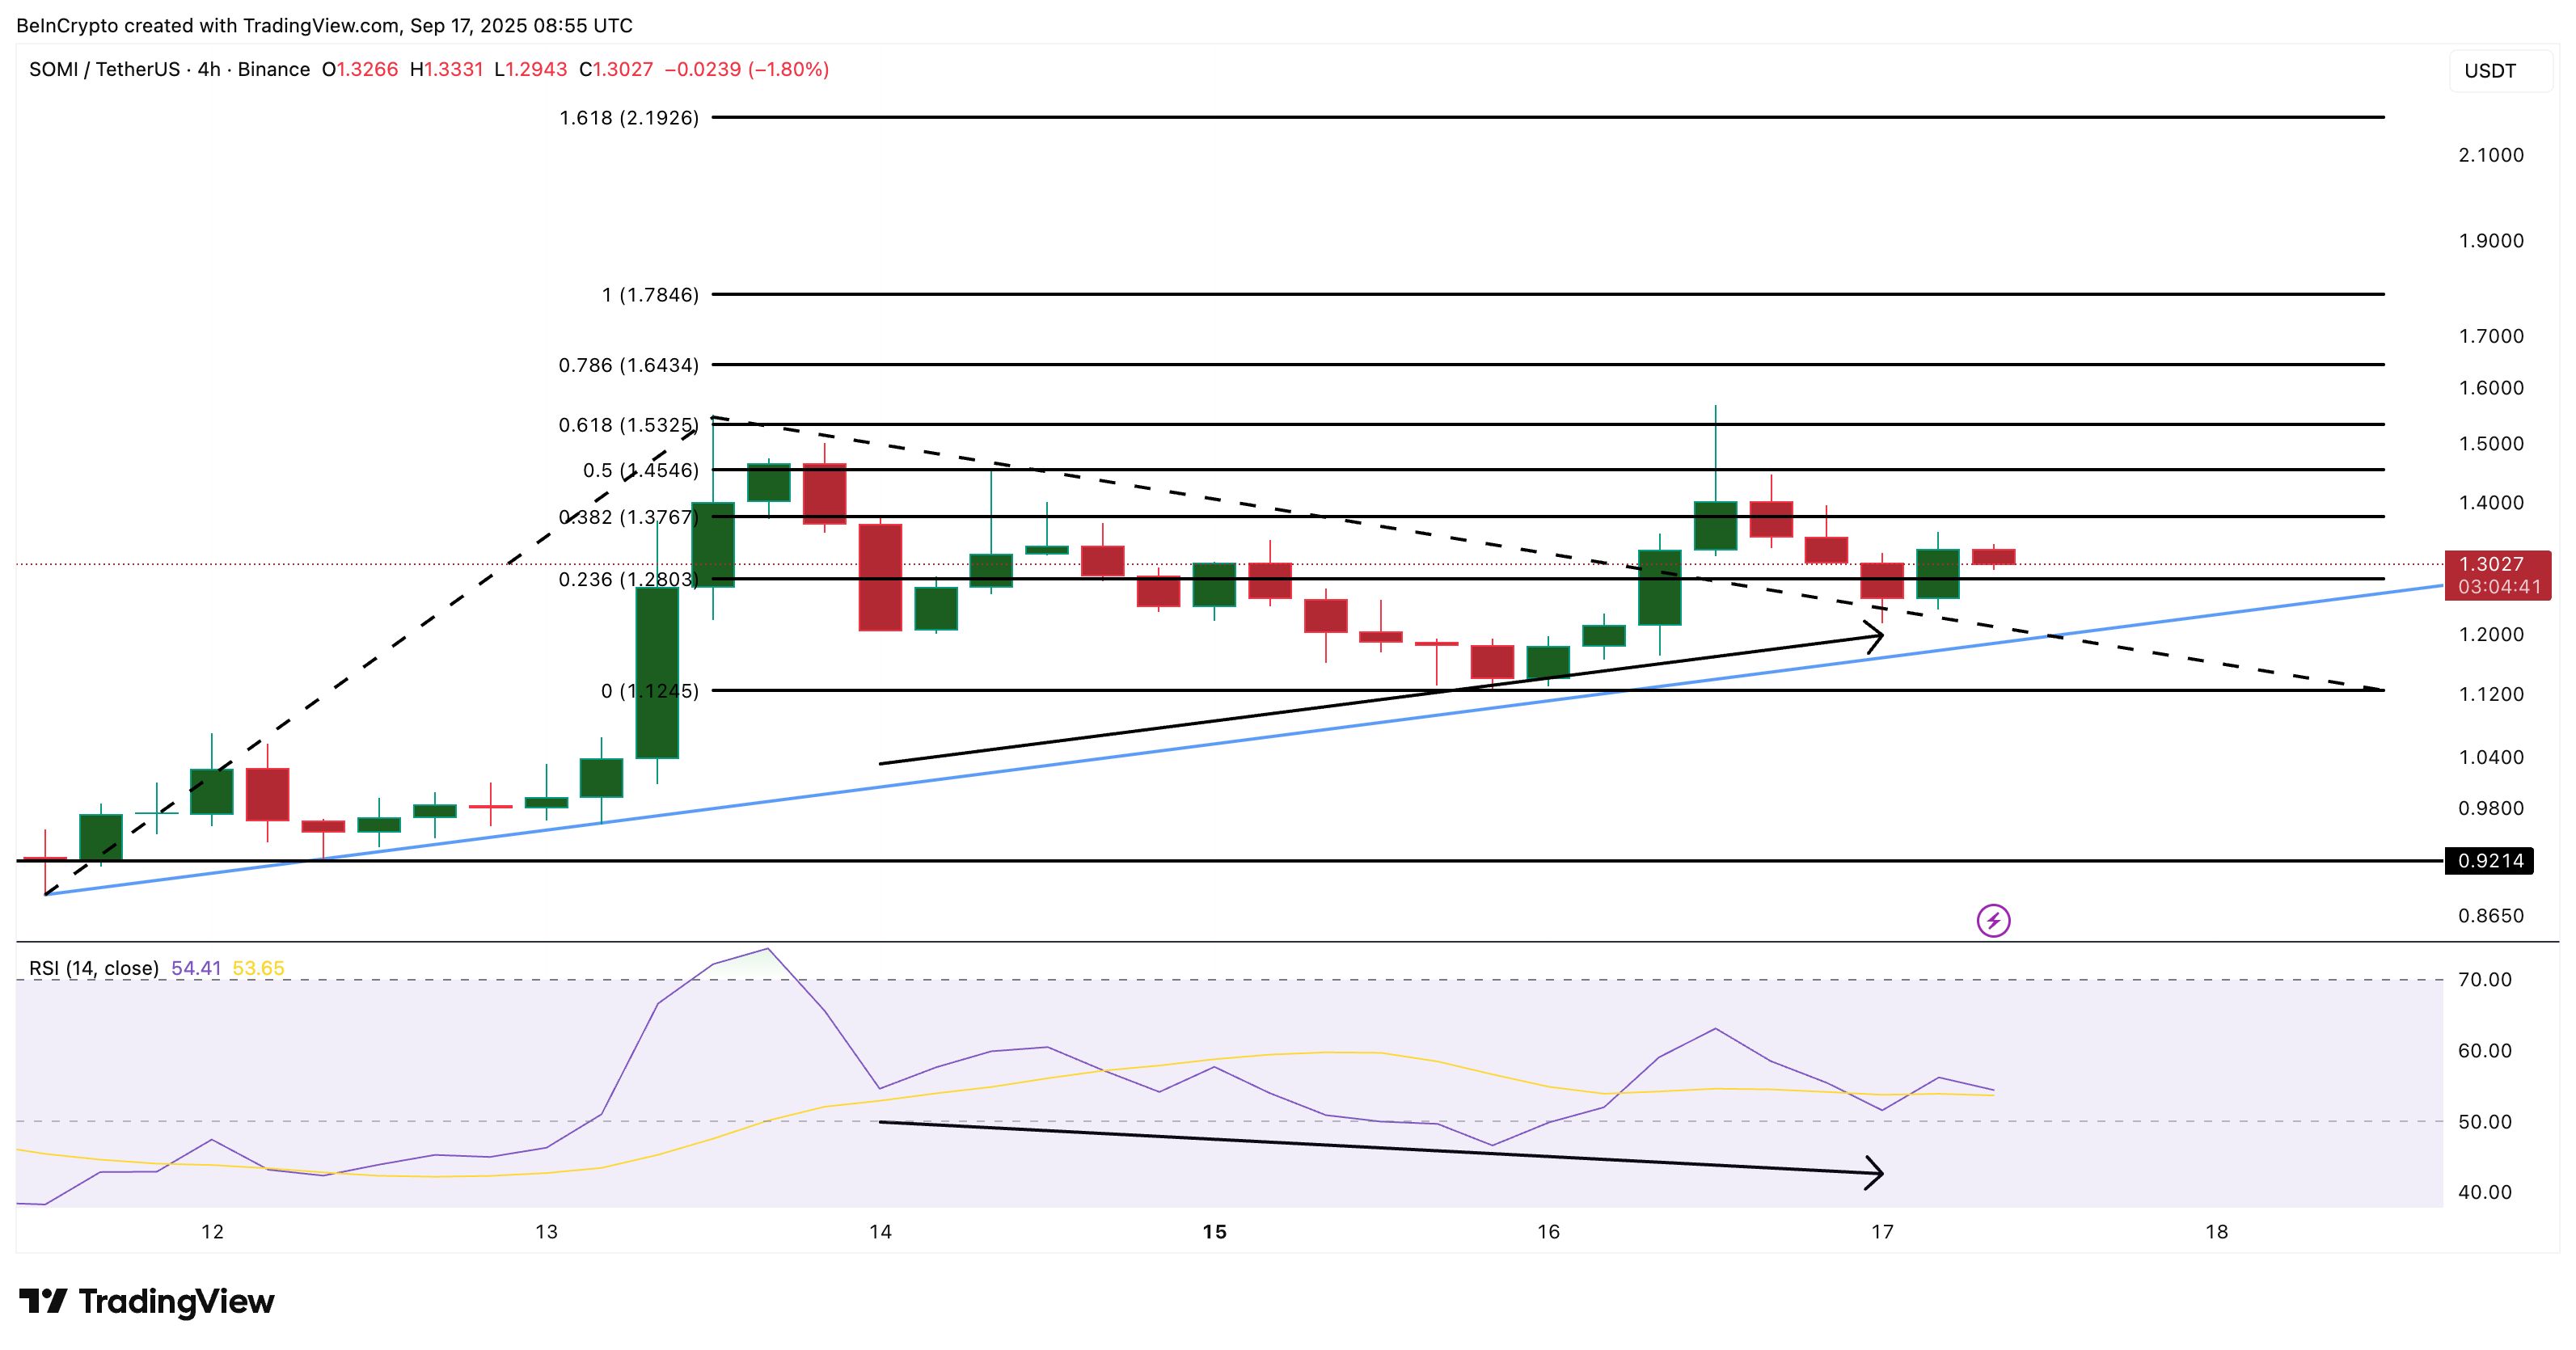 SOMI Price Analysis:
TradingView
A clean breakout above $1.53, where past bounces have been rejected, would mean that the rebound narrative changed into a rally setup. That would even bring the all-time high narrative back into play. In that scenario, upside targets sit at $1.78 and $2.19, based on Fibonacci extension levels.
Adding credibility to the setup is the Relative Strength Index (RSI). Between September 14 and September 17, SOMI’s price formed higher lows, while RSI made lower lows. This hidden bullish divergence often signals trend continuation, backing the rebound smart trader-friendly theory and supporting the case for cautious optimism.
Still, risks remain. The rebound hypothesis weakens if SOMI closes below $1.12, with a deeper slide possible toward $0.92. That could happen if smart money withdraws and bears take control of the SOMI price action.
Disclaimer: The content of this article solely reflects the author's opinion and does not represent the platform in any capacity. This article is not intended to serve as a reference for making investment decisions.
You may also like
Rakuten reports $6.4 million in US crypto ETF holdings, including spot XRP ETF

US PPI report to test Bitcoin, gold and Nasdaq as December rate hike looms
Nvidia falls to its lowest valuation in 14 years! "Super bull" Tom Lee calls for bottom fishing, retail investors are buying more as it drops, but Wall Street is divided
After the market opened on Thursday, retail investors went against the trend and bought up Nvidia, with net purchases reaching $111 million in just half an hour, setting a record for the same period. Investors such as Tom Lee have publicly supported the company, with institutions optimistic about strong order backlogs extending to 2028, robust revenue growth, and opportunities created by declining valuations. Meanwhile, institutions like Bernstein and Goldman Sachs have become more cautious about Nvidia's outlook, with concerns focusing on management succession and technological leadership following Jensen Huang's departure.
Jane Street boosts Fidelity Bitcoin ETF stake 8x in Q3, trims BlackRock IBIT

Crypto prices
More


