Stellar (XLM) is trading just below the key $0.38 resistance and may breakout if volume and daily closes confirm a trendline breach; a sustained move above $0.38 could open targets at $0.40 and $0.50, while a rejection risks $0.34 and lower supports.
-
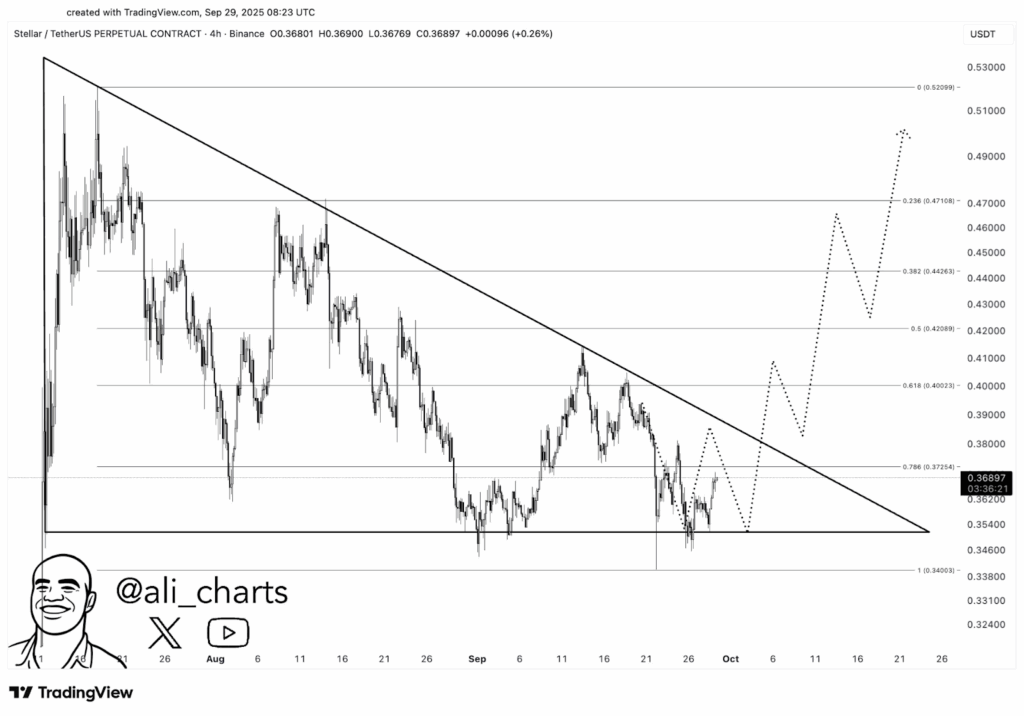
XLM at critical $0.38 resistance and 0.786 Fibonacci level
-
Rising TVL and improved long-to-short ratios signal growing on-chain activity and bullish sentiment
-
Technical indicators (RSI ~45, MACD nearing crossover) show fading bearish pressure and potential momentum shift
Stellar (XLM) price nears $0.38 resistance — watch breakout volume and daily close confirmations for a rally to $0.50. Read our technical summary and trade checklist.
Stellar (XLM) is heating up near the $0.38 mark. Charts and on-chain data hint at a breakout.
- XLM faces major resistance at $0.38, at the 0.786 Fibonacci retracement level.
- A breakout above the trendline could trigger upside toward $0.50.
- Rising TVL and bullish trader sentiment point to a potential breakout.
Stellar (XLM) is just below the crucial $0.38 resistance level. As of the writing time the price dipped 1.22% to $0.3656, a 0.72% weekly gain and rising trading volume show growing bullish momentum.
What is driving Stellar (XLM) toward the $0.38 level?
Stellar (XLM) is approaching a confluence of technical resistance: the 0.786 Fibonacci retracement near $0.3725 and a descending trendline around $0.38. Rising on-chain metrics and improving trader sentiment are increasing the probability of an upside breakout if volume confirms a close above the trendline.
How does the chart structure influence short-term XLM price action?
The 4-hour chart shows a descending triangle pattern that typically signals bearish risk, but current price action has compressed toward the triangle apex. XLM trades around $0.36897, just under the 0.786 Fibonacci retracement level at $0.37254. A decisive close above the descending trendline with increased volume would shift the technical bias to bullish.
 Source: Ali Charts Via X
Why does on-chain data matter for XLM’s breakout chances?
On-chain metrics provide real activity context beyond price. Stellar’s Total Value Locked (TVL) rose from $139.1 million on Saturday to $144.4 million by Tuesday, approaching an August peak of $153.6 million. Rising TVL typically reflects increased ecosystem usage and liquidity, supporting bullish price scenarios when paired with technical breakouts.
What do trader positioning and indicators show?
Market sentiment has tilted cautiously optimistic. CoinGlass reported a long-to-short ratio of 1.07, the highest in over a month, indicating more traders are positioned long. Daily RSI sits at ~45, moving toward neutral 50, while MACD lines are nearing a bullish crossover. These indicators suggest bearish pressure is fading but confirmation requires volume and daily closes.
When will a breakout or rejection be confirmed?
A breakout is most credible after: 1) a daily candle close above $0.38 and the descending trendline, and 2) a meaningful surge in trading volume. Conversely, a rejection would be signaled by a strong reversal candle at resistance and weakening volume, targeting $0.34 and potentially $0.32 on further downside.
Short checklist for traders monitoring XLM
- Watch for daily close above $0.38 with increased volume.
- Confirm MACD bullish crossover and RSI moving above 50.
- Monitor TVL and network activity for sustained on-chain support.
Comparison: key price levels and indicators
| Immediate resistance | $0.38 (0.786 Fib) | Break above opens $0.40–$0.50 |
| Support | $0.34 / $0.32 | Failure could extend losses |
| TVL | $144.4M (rising) | Improved on-chain liquidity |
| RSI (daily) | ~45 | Momentum shifting toward neutral/bullish |
Frequently Asked Questions
Will a break above $0.38 lead to a sustained rally to $0.50?
A sustainable rally to $0.50 requires a daily close above $0.38, elevated trading volume, and supportive momentum indicators. Without these confirmations, any spike could be a short-lived pullback.
How should traders manage risk around the triangle apex?
Use defined stop levels (e.g., below $0.34) and scale position size until a clear daily close confirms direction. Monitor volume and TVL to avoid trading on false breakouts.
Key Takeaways
- Resistance at $0.38: A decisive daily close above the 0.786 Fibonacci and trendline is needed to validate a bullish breakout.
- On-chain support: Rising TVL and a higher long-to-short ratio add credibility to an upside scenario.
- Confirm with volume: Volume surges and momentum crossovers will be the primary confirmation signals for a sustained rally.
Conclusion
Stellar (XLM) sits at a technical crossroads near $0.38, where a confirmed break with higher volume could open targets at $0.40 and $0.50, while a rejection risks support at $0.34 and $0.32. Monitor daily closes, volume, RSI and TVL for reliable signals. Stay disciplined and follow a clear risk plan.