Ethereum is forming a weekly bull flag, trading near $4,463; a confirmed breakout above $4,505 could target $6,900, supported by spot ETH ETF inflows (~$80M) and steady on-chain activity that bolster bullish momentum.
-
ETH current price: $4,463 with $4,505 as immediate resistance.
-
Upside targets: $6,035 (1.618 Fibonacci) and $6,900 (measured move).
-
Market drivers: Spot ETH ETF buys (~$80M), whale accumulation, and steady weekly volumes.
Ethereum bull flag gains momentum; ETH price target $6,900 if $4,505 breaks — read analysis and trade implications from COINOTAG.
What is the Ethereum bull flag and why does it matter?
The Ethereum bull flag is a weekly continuation pattern formed after a strong rally, signaling consolidation before a potential breakout. It matters because a confirmed breakout above $4,505 could accelerate returns toward key targets like $6,035 and $6,900, particularly with ETF inflows and on-chain accumulation supporting demand.
How do spot ETH ETFs and $80M inflows affect the ETH price?
Spot ETH ETFs increase institutional demand and liquidity, which can tighten available supply and lift price action. Reported single-day ETF purchases of about $80 million coincide with whale accumulation and steady weekly trading volumes, reinforcing the bullish structure and improving probability of a breakout. Market-cap snapshot: ETH market capitalization near $538 billion with 24h volume around $47 billion (CoinMarketCap, plain text).
Bull Flag Structure Strengthens
The weekly chart shows a classic bull flag: a sharp prior rally followed by a tight, downward-sloping consolidation channel. Ethereum moved from under $2,500 in June to above $4,000 in August, then formed higher lows inside the flag. A breakout above the upper trendline and $4,505 resistance is the technical trigger for measured-move targets.
#Ethereum Bull Flag 🎯
Weekly bull flag pattern forming on $ETH.
A breakout could send price toward $6,900 🚀 pic.twitter.com/5DmGqrZifs
— Titan of Crypto (Washigorira) October 2, 2025
Analysis prepared by Titan of Crypto sets a measured-move breakout target near $6,900, calculated from the length of the earlier rally extended beyond the consolidation zone. The dotted projection on the chart indicates potential continuation once a confirmed weekly breakout occurs.
Market Data and Technical Signals
Key market data points front-loaded:
- Price range (24h): $4,396 – $4,550; closing near $4,463.
- Market capitalization: ~$538 billion (CoinMarketCap, plain text).
- 24h volume: ~$47 billion (CoinMarketCap, plain text).
Analyst notes: Ali Martinez flags resistance at $4,505 as the immediate hurdle. Kamran Asghar notes a confirmed breakout above $4,282 with a 1.618 Fibonacci extension target at $6,035. Institutional flow data reported by SoSoValue shows spot ETF purchases around $80M in a single day, a notable demand signal when combined with on-chain whale accumulation.
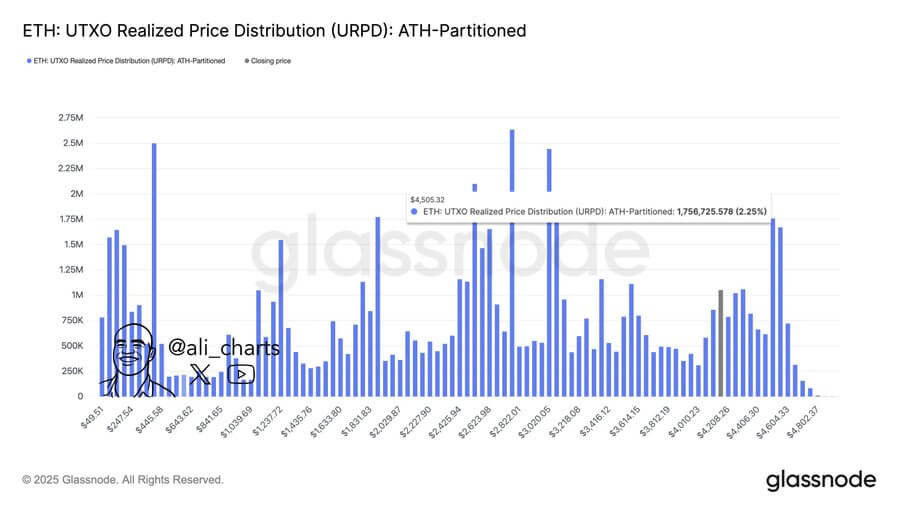 Source: AliMartinez (X)
How should traders interpret the technical setup?
Use clear triggers and risk management: a weekly close above $4,505 confirms continuation; a failure below the lower flag trendline invalidates the pattern. Volume confirmation—higher volumes on breakout—strengthens the signal. Apply stop-losses below recent swing lows and scale position sizes to volatility.
| Current price | $4,463 |
| Immediate resistance | $4,505 |
| Fibonacci target (1.618) | $6,035 |
| Measured move target | $6,900 |
| Reported ETF inflows (single day) | ~$80M |
Frequently Asked Questions
What price level confirms the bull flag breakout?
A weekly close above $4,505 that breaks the flag’s upper trendline with elevated volume generally confirms the breakout and opens targets like $6,035 and $6,900.
How much did spot ETH ETFs buy and why does it matter?
Spot ETH ETFs reportedly purchased around $80 million in one day. That volume matters because it signals institutional demand, which can support higher price targets if accumulation continues.
Key Takeaways
- Pattern: Weekly bull flag indicates consolidation with a bullish tilt.
- Trigger: Weekly close above $4,505 on strong volume confirms continuation.
- Drivers: Spot ETH ETF inflows (~$80M), whale accumulation, and steady on-chain metrics support upside.
Conclusion
Ethereum’s weekly bull flag and institutional flows create a high-probability bullish scenario if price clears $4,505. Traders should watch volume and on-chain metrics closely, use disciplined risk management, and monitor targets at $6,035 and $6,900. COINOTAG will continue tracking developments and updating levels as data evolves.