Date: Wed, Oct 08, 2025 | 06:10 PM GMT
The cryptocurrency market is showing signs of recovery today as Bitcoin (BTC) rebounded above $123,500 after dipping to a 24-hour low of $120,600.Also, Ethereum (ETH) turned green with a 1.37% gain, sparking momentum across several memecoins— including Mog Coin (MOG).
Although MOG is slightly down today, its recent price structure reveals a deeper story: the token is now retesting a key breakout level, which could determine whether the next move is another leg up or a short-term correction.
 Source: Coinmarketcap
Retesting Falling Wedge Breakout
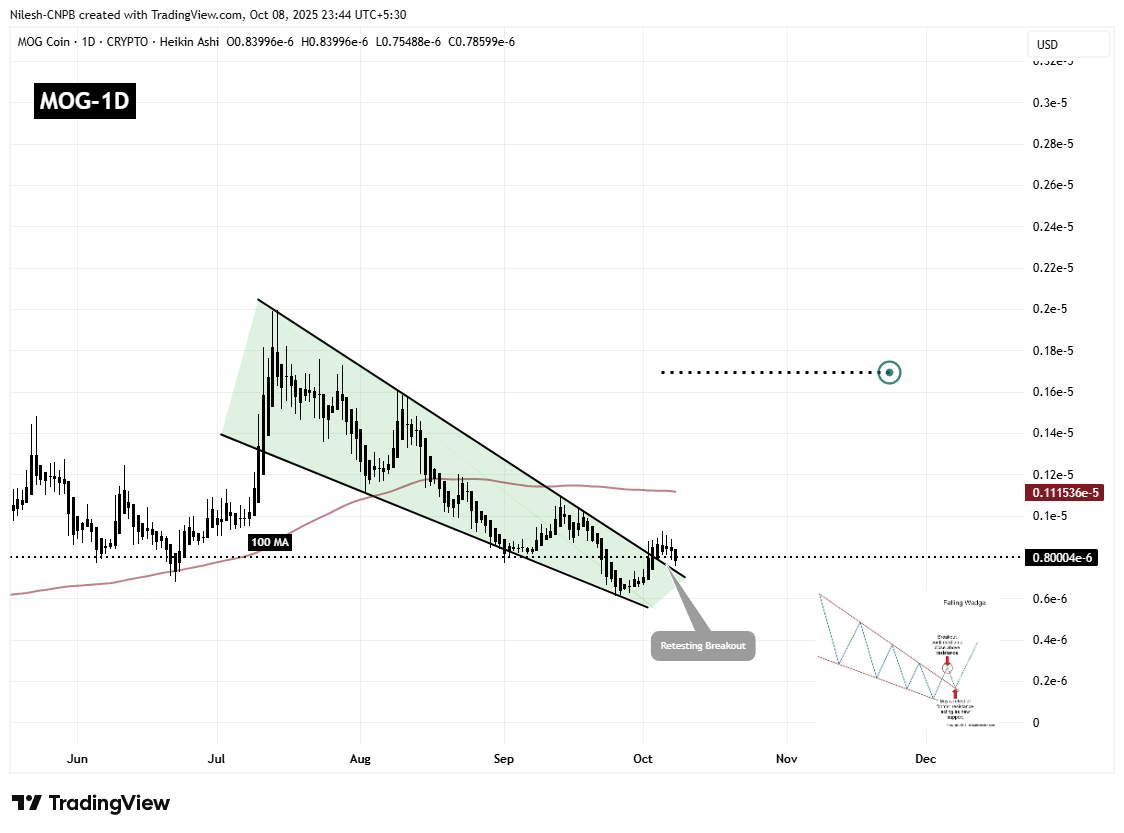
Over the past several weeks, MOG has been consolidating inside a falling wedge — a well-known bullish reversal pattern that often signals the end of a downtrend. The coin found solid footing near $0.00000061, where buyers began accumulating and pushing prices higher.
This accumulation led to a decisive breakout above the wedge’s resistance line near $0.0000008090, confirming a potential shift in market structure. Following this breakout, MOG surged to a local high of $0.0000009235, where short-term traders took profits, leading to a minor pullback.
 Mog Coin (MOG) Daily Chart/Coinsprobe (Source: Tradingview)
Now, as the chart shows, MOG is retesting the breakout zone around $0.00000075, aligning closely with the former resistance trendline — a level that typically transforms into support after a successful breakout.
What’s Next for MOG?
The current setup looks promising, but the key factor will be whether bulls can defend the breakout area. If buying pressure increases, MOG’s next challenge will be to reclaim the local high of $0.0000009235, followed by breaking above its 100-day moving average (MA) around $0.000001115.
Successfully holding above this zone could open the path toward the next technical target at $0.000001696, implying a potential upside of nearly 100% from current levels.
However, a failure to sustain above the breakout level might send the price back into the wedge, invalidating the breakout and potentially delaying bullish momentum.