Bitget App
Trade smarter
Buy cryptoMarketsTradeFuturesStocksEarnInstitutionAI & More
Is ether.fi (ETHFI) Gearing Up for a Bullish Move? Key Fractal Formation Suggest So!

Is ether.fi (ETHFI) Gearing Up for a Bullish Move? Key Fractal Formation Suggest So!

CoinsProbeCoinsProbe2025/10/09 19:30
By:Nilesh Hembade

Date: Thu, Oct 09, 2025 | 08:51 AM GMT

The cryptocurrency market is witnessing a wave of volatility today after an impressive rally that sent Bitcoin (BTC) to a new all-time high of $126,000 before correcting to around $121,000. Meanwhile, Ethereum (ETH) has slipped over 3%, causing mild pressure across major altcoins — including ether.fi (ETHFI).

Despite ETHFI’s 6% decline today, its latest technical setup is hinting at a possible bullish formation, one that closely mirrors Zcash (ZEC)’s explosive breakout earlier this year.

Is ether.fi (ETHFI) Gearing Up for a Bullish Move? Key Fractal Formation Suggest So! image 0 Source: Coinmarketcap

ETHFI Mirrors ZEC’s Breakout Pattern

The comparison between ETHFI and ZEC on the daily chart reveals a remarkable structural similarity, suggesting a potential fractal repetition.

ZEC recently completed a double breakout sequence — first from a falling wedge and then from an ascending resistance trendline, which led to a powerful 330% rally from the breakout zone.
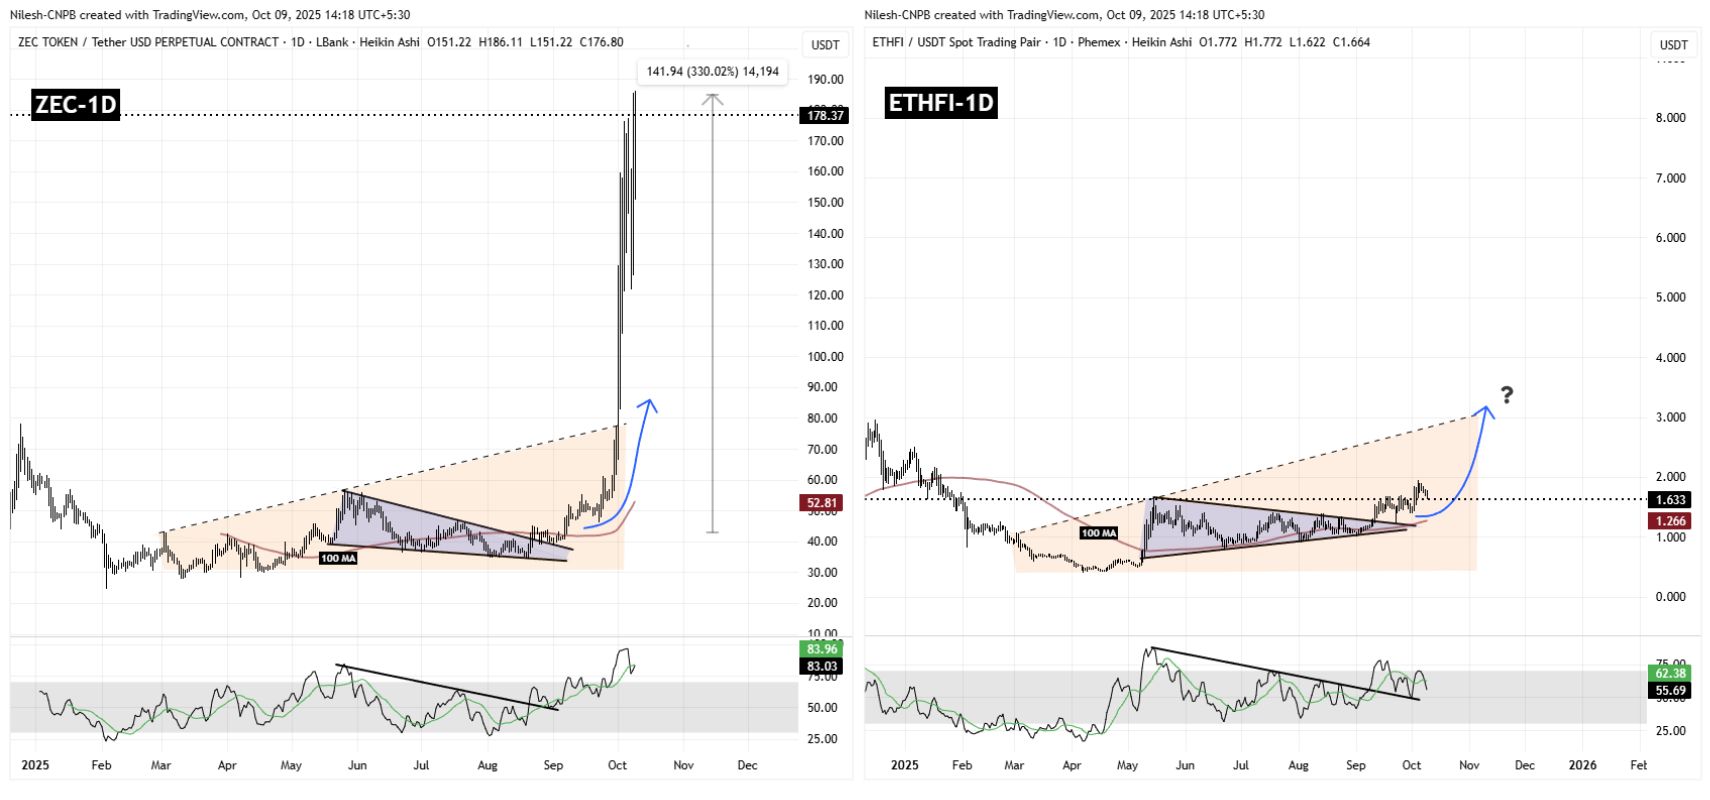
Is ether.fi (ETHFI) Gearing Up for a Bullish Move? Key Fractal Formation Suggest So! image 1 ZEC and ETHFI Fractal Chart/Coinsprobe (Source: Tradingview)

Now, ETHFI appears to be mirroring the same pattern. The token has already broken above its symmetrical triangle, confirmed a RSI breakout, and initiated a short-term rally before undergoing the current retracement.

This retracement phase looks almost identical to ZEC’s structure before its major breakout, hinting at possible accumulation before another leg higher.

What’s Next for ETHFI?

If ETHFI continues to follow ZEC’s historical fractal pattern, the current pullback may act as a springboard for the next major rally. The key confirmation signal lies in the RSI indicator — currently at 55.37. A clean move above its moving average line around 62.36 would confirm the return of bullish momentum.

Once confirmed, ETHFI could target the ascending resistance trendline near $3.0, which aligns perfectly with the fractal projection. A successful breakout above that level could potentially trigger a sharp upward rally, with extended targets possibly reaching the $5.0 region — similar to ZEC’s explosive surge.

However, if ETHFI fails to hold its 100-day moving average (MA) around $1.26, the fractal setup might weaken, leading to a period of sideways consolidation before the next directional move.


0
0

Disclaimer: The content of this article solely reflects the author's opinion and does not represent the platform in any capacity. This article is not intended to serve as a reference for making investment decisions.

Understand the market, then trade.
Bitget offers one-stop trading for cryptocurrencies, stocks, and gold.
Trade now!

You may also like

U.S. chip stocks drop for eight consecutive sessions! $2 trillion wiped out in market value, marking the longest losing streak since 2008

This week, the investment prospects of AI were questioned by the market. The Philadelphia Semiconductor Index fell by 11.4%, and the Nasdaq dropped more than 4% in a single week. CoreWeave's stock price fell over 25% during the week, and its bonds dropped to distressed levels, casting doubt on the high-yield debt financing model. Strategists warned that being overly bearish could lead to missing opportunities, while "Wood Sister" bucked the trend and increased her holdings of CoreWeave.

华尔街见闻•2026/10/16 21:53

In August, overseas funds returned to the U.S. Treasury market; UK holdings surpassed $1 trillion for the first time; Japan and China continued to reduce holdings, with China’s U.S. Treasury holdings hitting the lowest level since 2008

According to a report by the U.S. Treasury Department, overseas investors made net purchases of $108.9 billion in U.S. Treasury bonds in August, reversing a two-month decline in holdings. Among the top ten countries and regions holding U.S. debt, only China and Japan reduced their holdings in August. Japan, the largest holder, saw its holdings drop for the fourth consecutive month, reaching a 22-month low in the same month it intervened in the foreign exchange market. China’s holdings declined for the third straight month, hitting new lows for two consecutive months not seen since 2008. The UK, the second-largest holder, posted historic highs for two consecutive months. Canada recorded the largest increase in August, up $38.3 billion, ranking fifth overall. Belgium had the second-largest increase, up $19.8 billion.

华尔街见闻•2026/10/16 21:53
In August, overseas funds returned to the U.S. Treasury market; UK holdings surpassed $1 trillion for the first time; Japan and China continued to reduce holdings, with China’s U.S. Treasury holdings hitting the lowest level since 2008