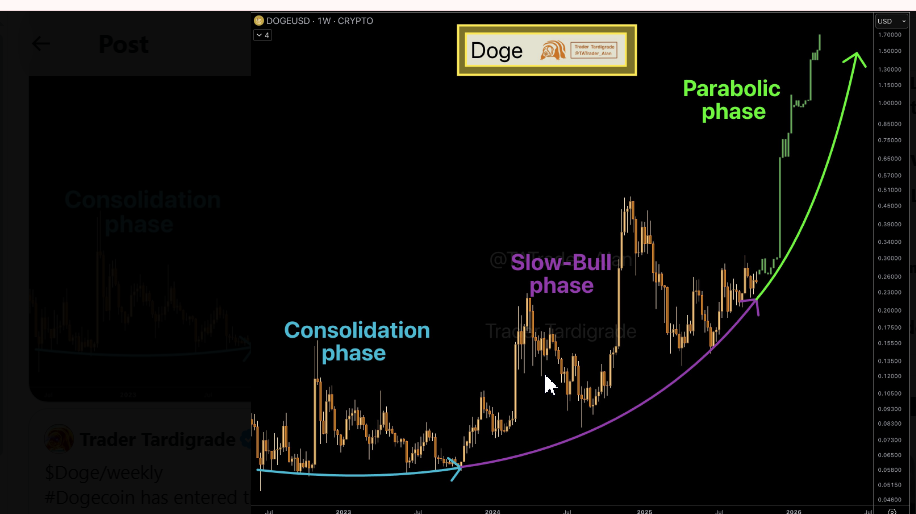
- The weekly chart of dogecoin has shown that it has shifted away to the parabolic phase of consolidation, with an increasing momentum above $0.24.
- The support is at a level of $0.2436 and the resistance is at a level of $0.2607 implying the possibility of a breakout setup.
- The slow gradient of the trendline indicates steady accumulation, which forms the foundation of the accelerated growth in the future sessions.
The weekly chart of Dogecoin shows that it may be subject to a change in the long-term structure, with the technical data showing that it may change the accumulation straight line to a more pronounced price curve. Dogecoin was valued at the time of the report at $0.2449, which is a loss of 1.7 percent per day. In comparison to Bitcoin, the asset had a 1.1% growth as per 0.052005 BTC.
The coin has support at the moment of about $0.2436 with the resistance occurring at about $0.2607. The trend of prices during the last few months indicates three phases namely: consolidation, gradual bull trend and a new parabolic movement. These phases outline the pattern that is seen in the weekly Dogecoin/USD chart.
Dogecoin Shows Early Uptrend Signs as Price Gradually Moves Beyond Consolidation
The chart reveals that Dogecoin has completed an extended consolidation phase, where prices moved within a narrow range. This phase established a stable foundation for further price development. Notably, repeated tests of lower support levels created a clear base structure around the $0.24–$0.25 range. The continuation of this pattern has provided stability in market behavior, especially during lower volatility periods.
 Source: (X)
However, recent data show momentum building above this consolidation area. The formation of higher lows suggests early pressure toward the upper resistance zone at $0.2607. The trendline curvature on the chart now supports the beginning of what appears to be a slow-bull phase, marked by modest but consistent upward movements. This phase serves as a transition point before larger price acceleration.
Gradual Uptrend Marks Transition from Accumulation to Emerging Parabolic Phase
Following the accumulation period, the slow-bull phase highlights a steady market expansion. Price action in this section indicates gradual appreciation supported by moderate trading volumes. The curved purple trendline on the weekly chart visually captures this growth. Each price retracement during this period has produced higher troughs, signaling sustained buyer activity around established support.
The structure also emphasizes how price recovery has followed predictable technical behavior. While momentum remains controlled, the upward slope of the curve implies rising confidence within the trading range. This section bridges the early consolidation to what the chart identifies as the next market stage — the parabolic phase.
Dogecoin Positions Near Parabolic Growth Zone as Weekly Structure Strengthens
The current setup projects Dogecoin approaching the parabolic phase, marked by the steep green curve on the chart. This phase reflects accelerating price growth as demand builds above prior resistance. The price projection beyond $1.00 highlights the expanding trajectory consistent with the pattern’s curvature.
Although still early, the technical framework on the weekly chart presents a clear transition from structural consolidation to vertical growth formation. Each previous phase has contributed to this pattern, and current levels around $0.2449 remain critical in confirming continued movement toward the projected parabolic advance.