
HBAR Price at Risk of Dropping to July Lows Amid Weak Momentum

HBAR’s sideways momentum shows signs of fading as selling pressure builds. With RSI and Elder-Ray Index turning bearish, the token risks falling back to its July low near $0.18 if support at $0.2089 fails to hold.
Hedera Hashgraph’s native token HBAR has stalled despite the recent market rebound, remaining largely sideways since September 22.
Market indicators now signal growing bearish pressure, suggesting the token could break below its support level.
Sideways No More? HBAR Risks Cracking $0.2089 Support
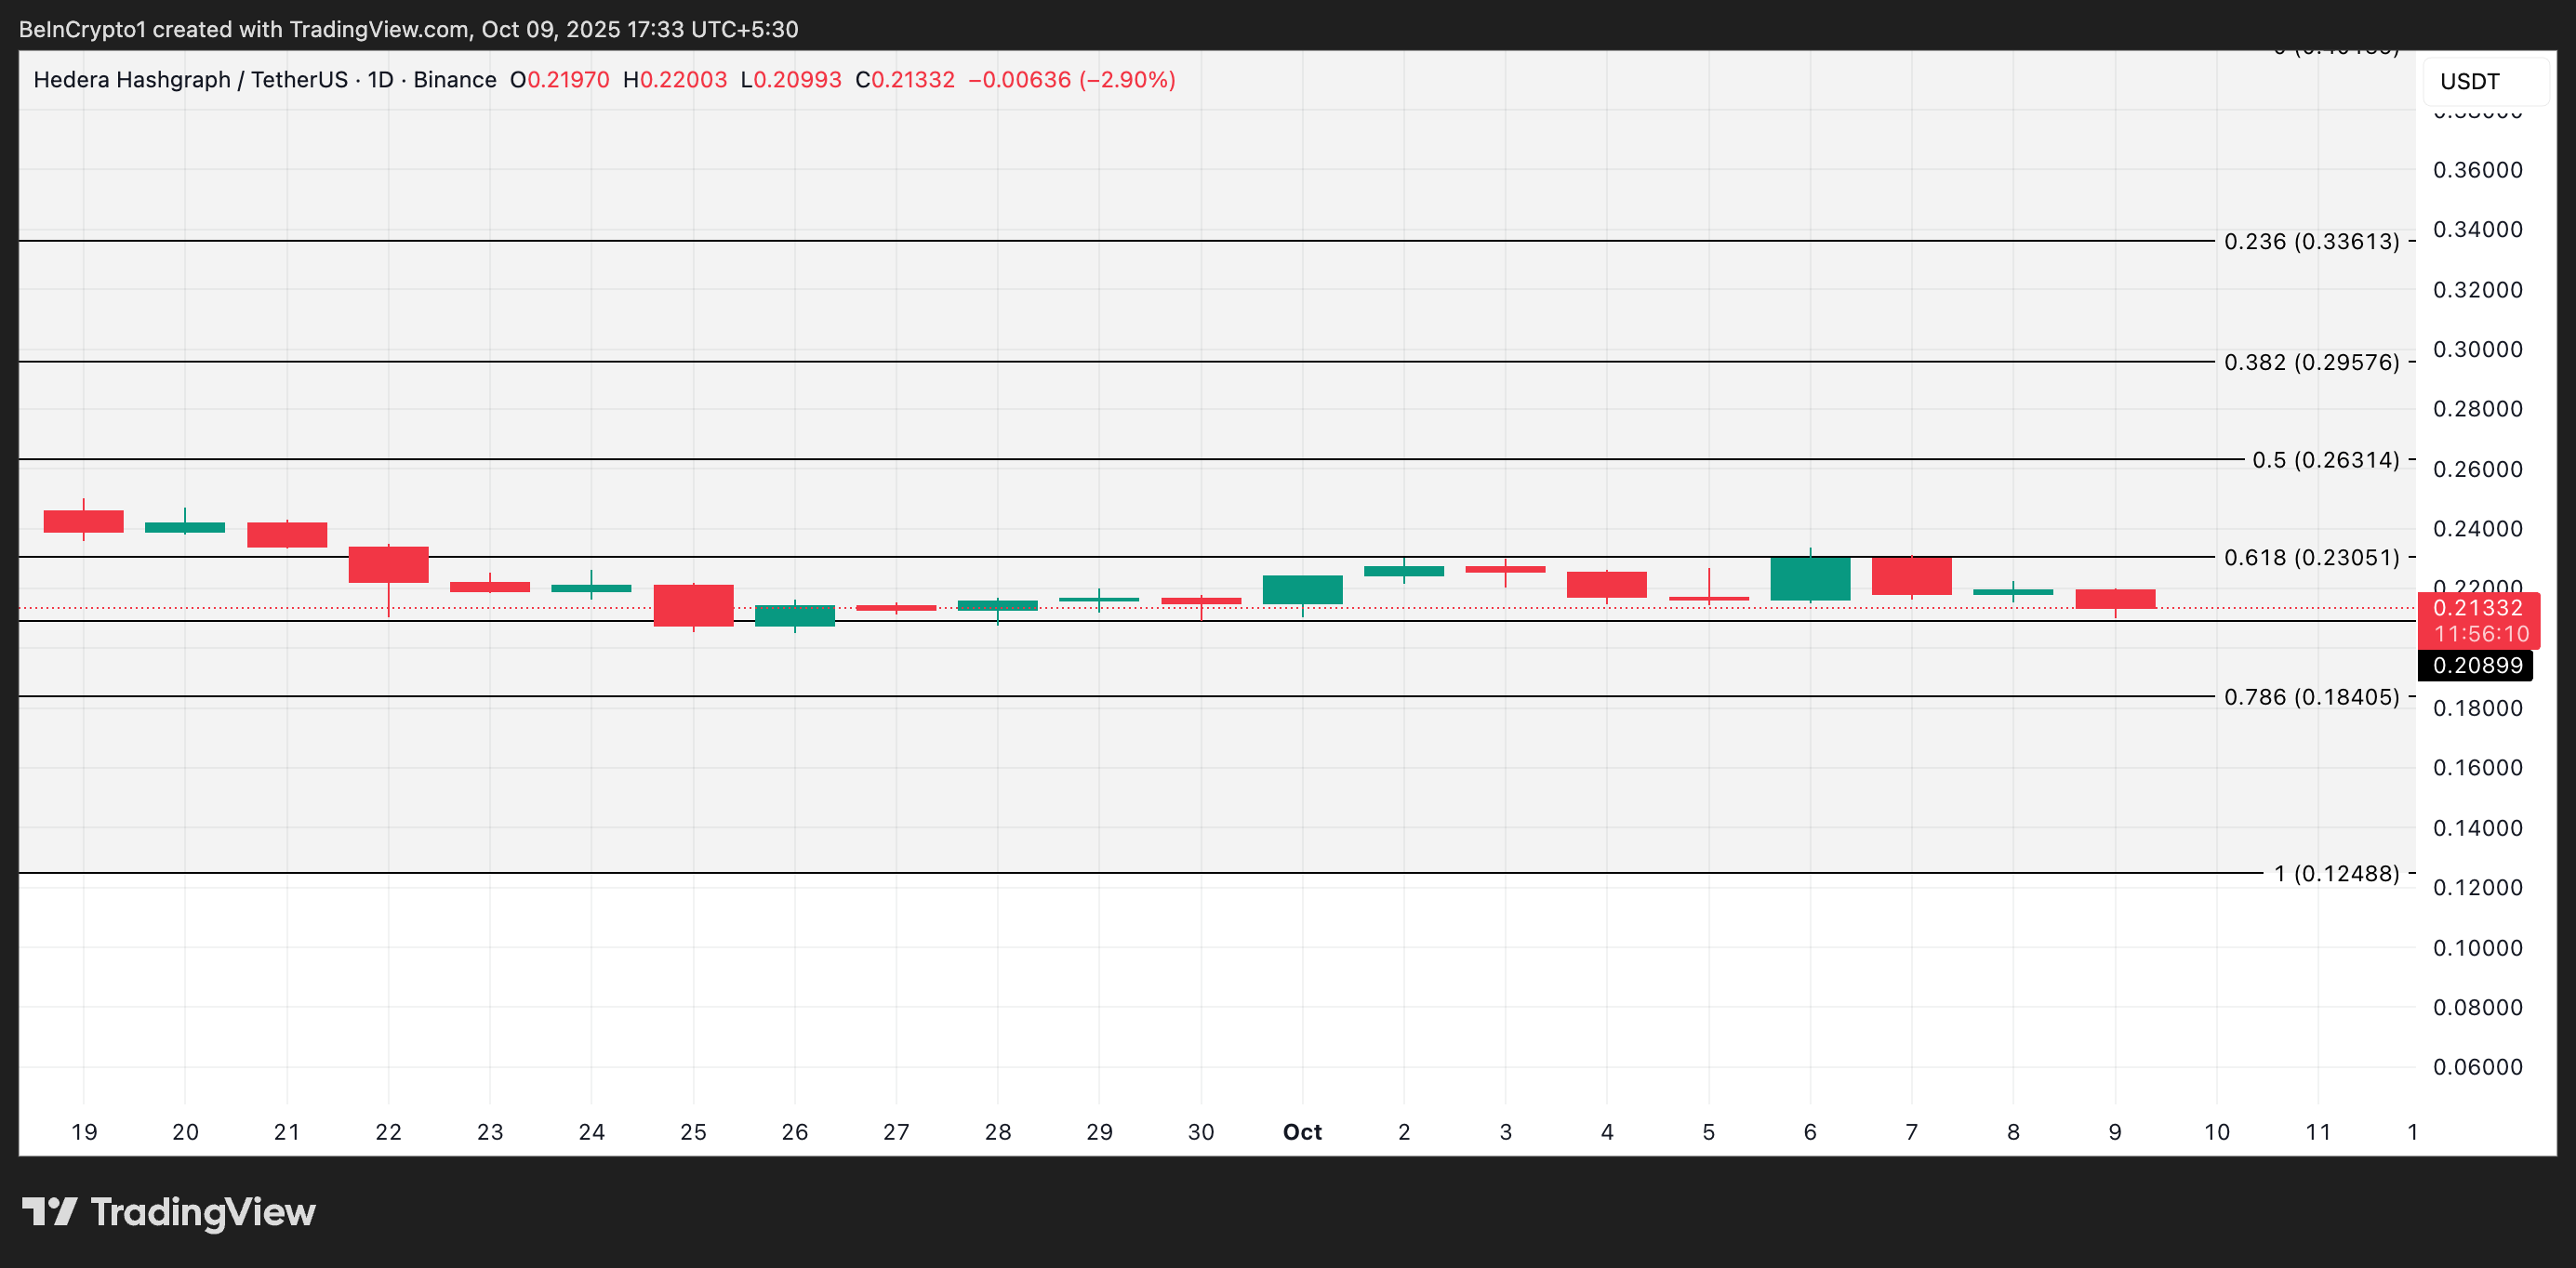
Readings from the HBAR/USD one-day chart show that the altcoin has trended sideways since September 22, facing resistance near $0.2305 and finding support at $0.2089.
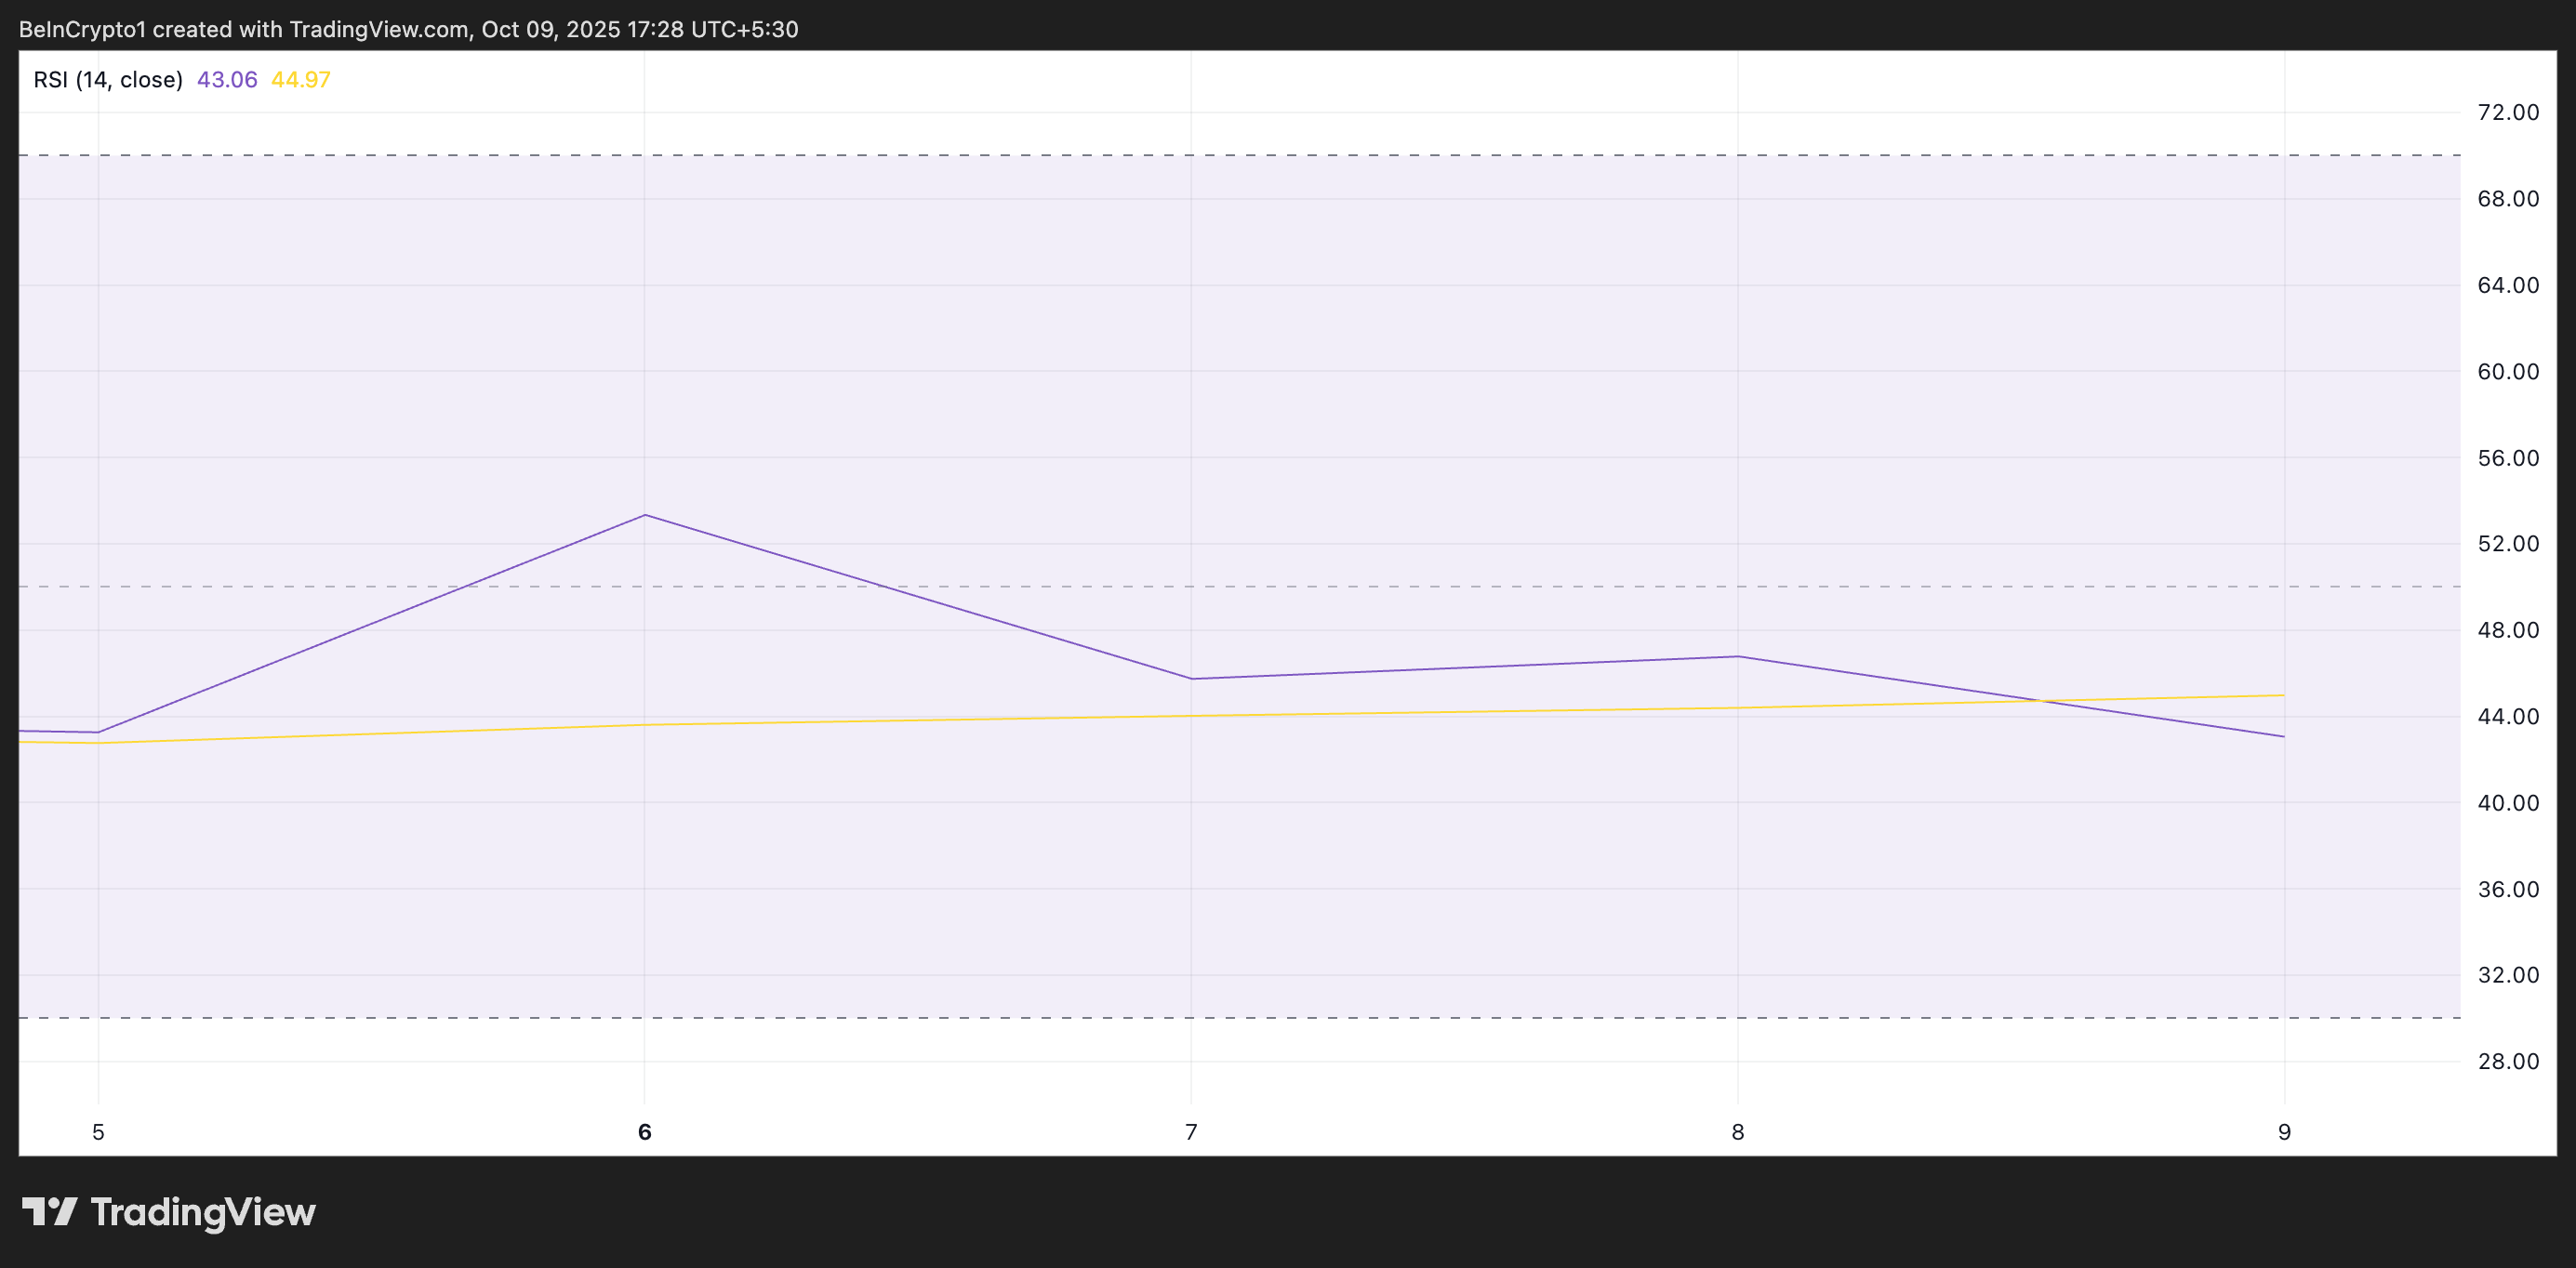
With the growing bearish tilt in broader market sentiment, technical indicators now point to a likelihood of a breach of that support floor in the near term. For example, HBAR’s Relative Strength Index (RSI) continues to fall, and is currently at 43.06 at press time.
For token TA and market updates: Want more token insights like this? Sign up for Editor Harsh Notariya’s Daily Crypto Newsletter .
 HBAR RSI. Source:
TradingView
HBAR RSI. Source:
TradingView
An asset’s RSI indicator measures its overbought and oversold market conditions. Its values range between 0 and 100. Values above 70 suggest that the asset is overbought and due for a price decline, while values under 30 indicate that the asset is oversold and may witness a rebound.
At 43.06, HBAR’s RSI signals weakening momentum. It hovers below the neutral 50 level and suggests that selling pressure could continue to outweigh buying interest.
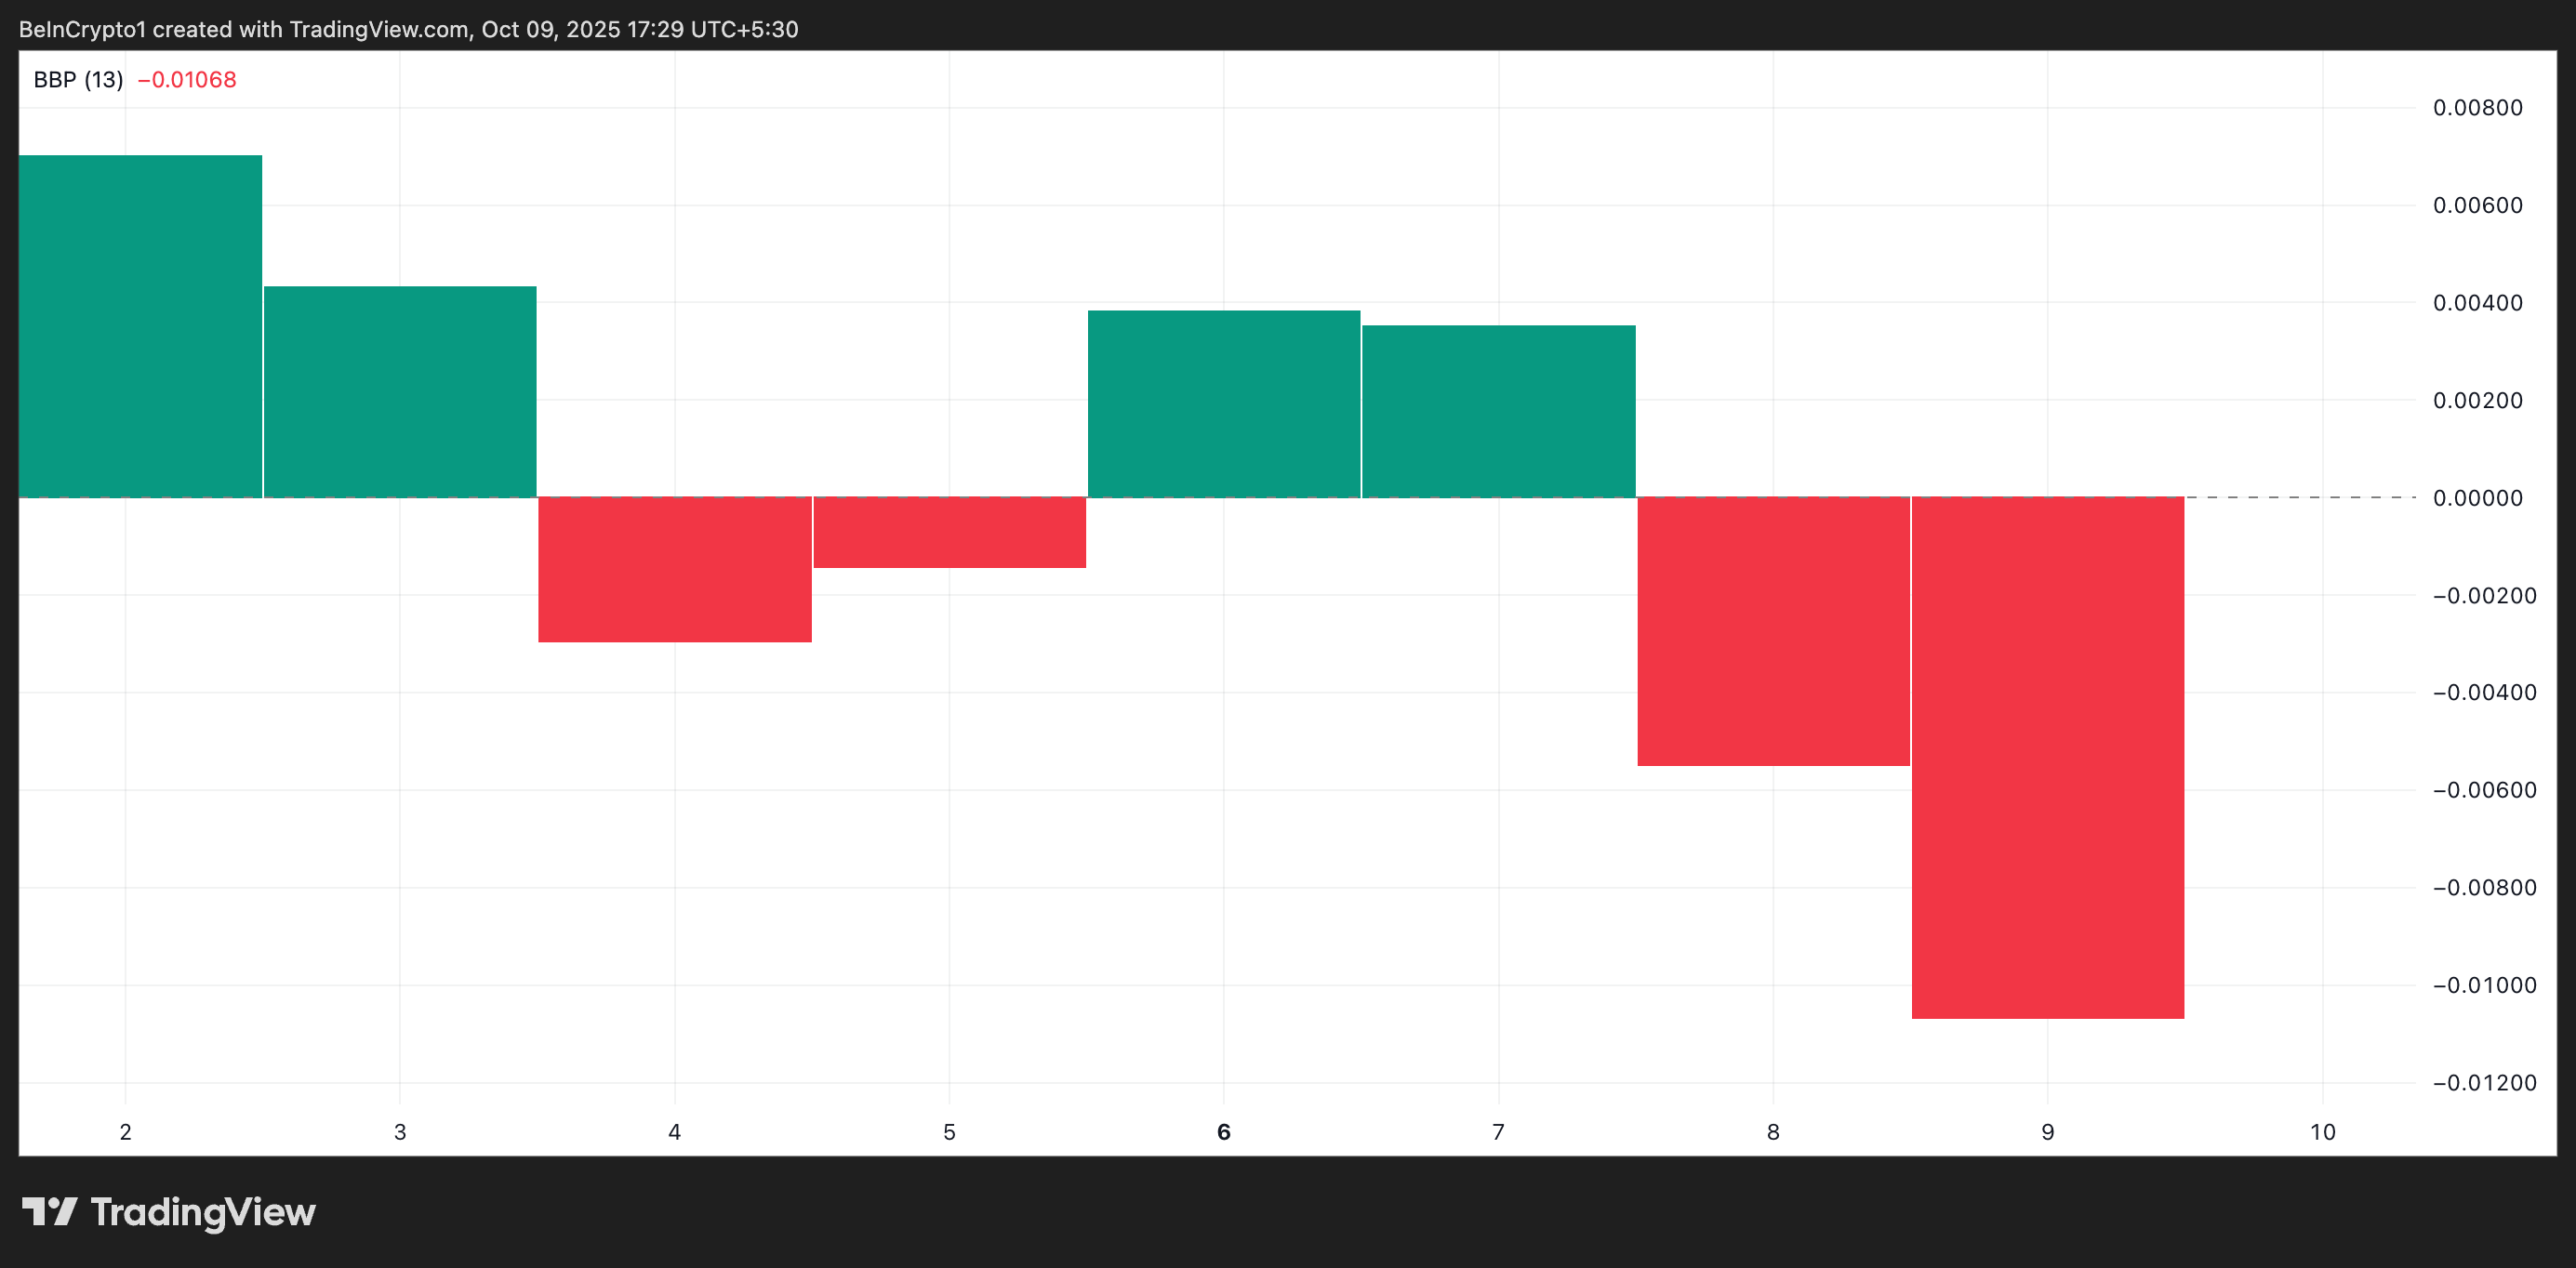
Furthermore, readings from HBAR’s Elder-Ray Index confirm this bearish bias. As of this writing, the indicator’s value is at -0.01051.
 HBAR Elder-Ray Index. Source:
TradingView
HBAR Elder-Ray Index. Source:
TradingView
The Elder-Ray Index indicator measures the strength of bulls and bears in the market by comparing buying pressure (Bull Power) and selling pressure (Bear Power).
When the value is positive, the market is experiencing more buying pressure than selling, suggesting a potential uptrend.
However, when the value turns negative, as it has for HBAR, it signals that bearish forces dominate the market.
Will Buyers Hold the Line or Let Bears Drag It to $0.18?
If the bearish trend persists and HBAR breaches the support at $0.2089, it risks revisiting its July low of $0.18405, which could mark the next key support level.
 HBAR Price Analysis. Source:
TradingView
HBAR Price Analysis. Source:
TradingView
Conversely, increasing buyer activity could trigger a rally above its current sideways range and push HBAR’s price to $0.2631.
Disclaimer: The content of this article solely reflects the author's opinion and does not represent the platform in any capacity. This article is not intended to serve as a reference for making investment decisions.
You may also like
U.S. chip stocks drop for eight consecutive sessions! $2 trillion wiped out in market value, marking the longest losing streak since 2008
This week, the investment prospects of AI were questioned by the market. The Philadelphia Semiconductor Index fell by 11.4%, and the Nasdaq dropped more than 4% in a single week. CoreWeave's stock price fell over 25% during the week, and its bonds dropped to distressed levels, casting doubt on the high-yield debt financing model. Strategists warned that being overly bearish could lead to missing opportunities, while "Wood Sister" bucked the trend and increased her holdings of CoreWeave.
In August, overseas funds returned to the U.S. Treasury market; UK holdings surpassed $1 trillion for the first time; Japan and China continued to reduce holdings, with China’s U.S. Treasury holdings hitting the lowest level since 2008
According to a report by the U.S. Treasury Department, overseas investors made net purchases of $108.9 billion in U.S. Treasury bonds in August, reversing a two-month decline in holdings. Among the top ten countries and regions holding U.S. debt, only China and Japan reduced their holdings in August. Japan, the largest holder, saw its holdings drop for the fourth consecutive month, reaching a 22-month low in the same month it intervened in the foreign exchange market. China’s holdings declined for the third straight month, hitting new lows for two consecutive months not seen since 2008. The UK, the second-largest holder, posted historic highs for two consecutive months. Canada recorded the largest increase in August, up $38.3 billion, ranking fifth overall. Belgium had the second-largest increase, up $19.8 billion.
Strategy surpasses JPMorgan in trading volume as MSTR neared 49M shares in August

Crypto prices
More


