Bitget App
Trade smarter
Buy cryptoMarketsTradeFuturesStocksEarnInstitutionAI & More
Dash (DASH) To Rally Higher? This Emerging Bullish Fractal Saying Yes!

Dash (DASH) To Rally Higher? This Emerging Bullish Fractal Saying Yes!

CoinsProbeCoinsProbe2025/10/12 09:03
By:Nilesh Hembade

Date: Sun, Oct 12, 2025 | 06:44 AM GMT

After witnessing one of the most unforgettable and painful events on Friday night that triggered a massive $19 billion in liquidations , the cryptocurrency market today is showing flat momentum — except for a few standout altcoins. Among them, Dash (DASH) has caught attention after beating the broader market selloff.

DASH has surged by an impressive 37% today, and its latest technical setup is hinting at a potential bullish reversal structure — one that closely mirrors Zcash’s (ZEC) explosive rally earlier this month.

Dash (DASH) To Rally Higher? This Emerging Bullish Fractal Saying Yes! image 0 Source: Coinmarketcap

DASH Mirrors ZEC’s Breakout Pattern

A side-by-side comparison of DASH and ZEC on the daily charts reveals a striking similarity in structure, suggesting that a fractal repetition may be unfolding.

As shown in the chart, ZEC reclaimed its 100-day moving average at the bottom and cleared a key resistance before making a massive bullish breakout from a rounding bottom pattern by breaking its neckline. That move triggered a 284% rally, pushing ZEC to new multi-month highs.
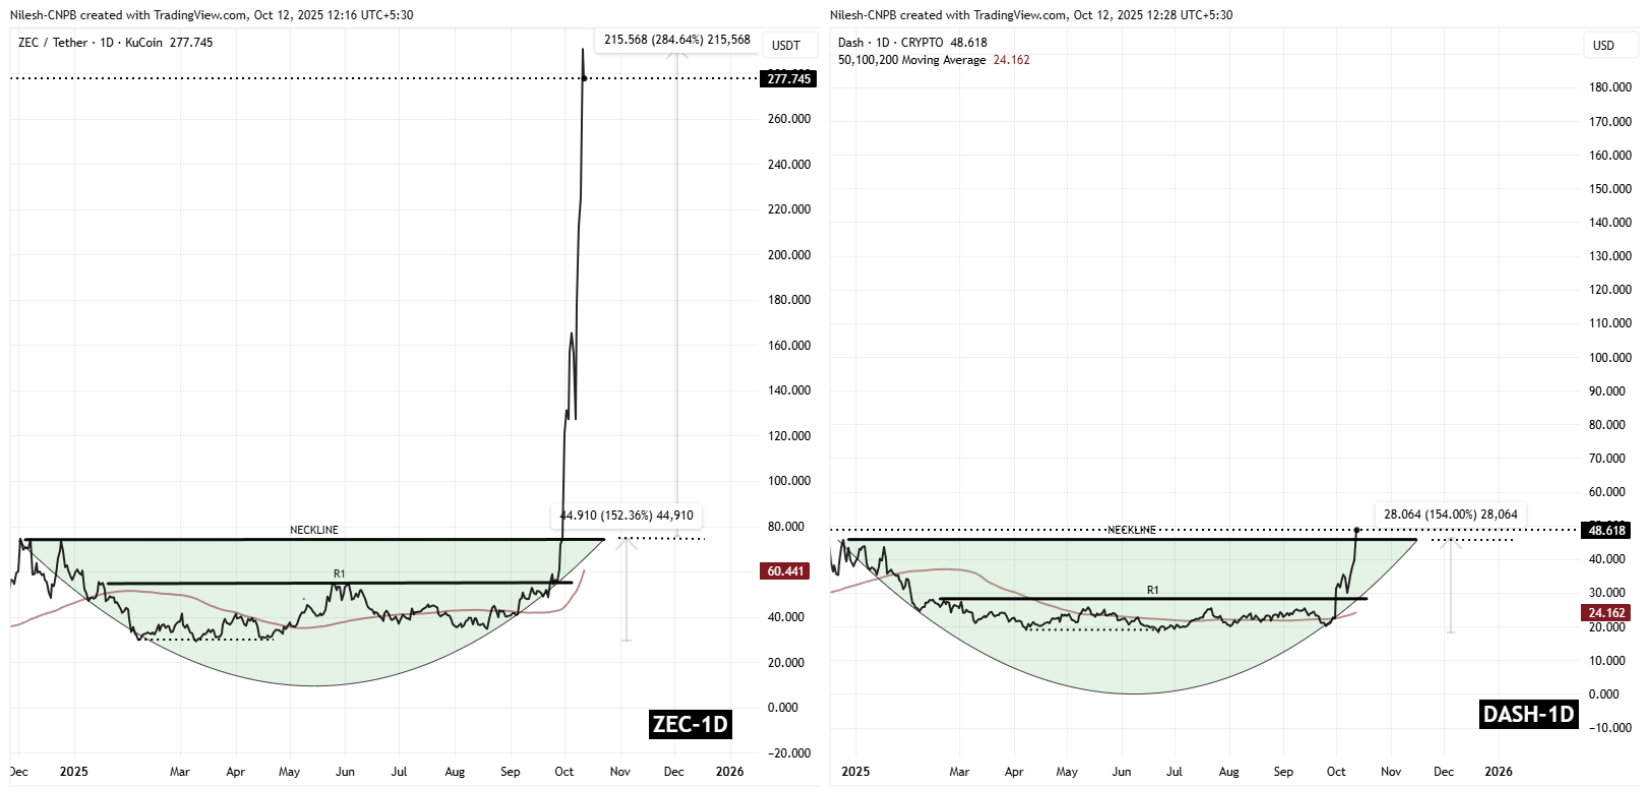
Dash (DASH) To Rally Higher? This Emerging Bullish Fractal Saying Yes! image 1 ZEC and DASH Fractal Chart/Coinsprobe (Source: Tradingview)

Now, DASH appears to be following a nearly identical setup. After reclaiming its 100-day moving average and breaking above its R1 resistance, DASH has just made a neckline breakout around $46.0 — a region that looks strikingly similar to ZEC’s consolidation phase just before its explosive move.

What’s Next for DASH?

If DASH continues to mirror ZEC’s fractal behavior, this neckline breakout could act as a launchpad for the next major rally. The $46 level, which previously acted as a strong resistance, now becomes a key support zone to hold.

Should DASH sustain above this support, technical projections suggest the next target could be around the $73 region, representing a potential 55% upside from current levels. If the pattern truly follows ZEC’s trajectory, the token could eventually aim for $180, aligning with the magnitude of ZEC’s recent breakout surge.

However, it’s important to note that fractal patterns do not guarantee identical outcomes. Market sentiment, liquidity, and broader conditions could still influence the final result.


0
0

Disclaimer: The content of this article solely reflects the author's opinion and does not represent the platform in any capacity. This article is not intended to serve as a reference for making investment decisions.

Understand the market, then trade.
Bitget offers one-stop trading for cryptocurrencies, stocks, and gold.
Trade now!

You may also like

The most dangerous divergence in U.S. stocks: ordinary stocks have already plummeted, how much longer can AI giants hold on?

Significantly tightened financial conditions are heavily impacting ordinary stocks in the US stock market, with the median S&P 500 constituent falling 15% from its peak and the equity risk premium dropping below zero. Rising US Treasury yields and oil prices have pushed the financial conditions index sharply higher, resulting in a severe deterioration in breadth beneath the apparent calm of the index. Market divergence is intensifying, raising the core uncertainty of whether ordinary stocks will catch up or the index will converge downward.

华尔街见闻•2026/10/17 04:01
The most dangerous divergence in U.S. stocks: ordinary stocks have already plummeted, how much longer can AI giants hold on?

Wall Street sets the midterm election price: Democratic Party factors surge 20%, but the market remains in a "blind zone"

The "Democratic Factor" built by JPMorgan has risen by about 20% since August, while the S&P 500 has only increased by 2.6% over the same period. Prediction platforms show that the probability of Democrats winning both chambers has surged from 23% in August to 64%. Historical data from Goldman Sachs indicates that this probability typically falls by about 5 percentage points on average before Election Day. There is a clear split among institutions: JPMorgan advocates buying on dips, while Bank of America warns that a Democratic sweep could lead to a drop of more than 10% in the stock market.

华尔街见闻•2026/10/17 01:26