Date: Tue, Oct 14, 2025 | 05:35 AM GMT
The cryptocurrency market is once again showing weakness after Monday’s brief rebound that pushed Ethereum (ETH) to a 24-hour high of $4,292 before sliding back into red territory around $4,089 today.
Following ETH’s move, several major altcoins are also flashing bearish setups, including Solana (SOL) — which, despite trading slightly in green, appears to be forming a potentially bearish pattern on the lower timeframe chart.
 Source: Coinmarketcap
Rising Wedge in Play?
On the 1-hour chart, Solana seems to be consolidating within a rising wedge — a pattern that often signals a potential trend reversal or downside breakout after an extended upward move. The price action has been printing higher highs and higher lows, but the slope of these moves is tightening, indicating weakening bullish momentum.
Recently, SOL was rejected from the wedge’s upper resistance near $211.25, which triggered a pullback. The correction has since driven the token down toward the lower boundary of the wedge, hovering around $202.
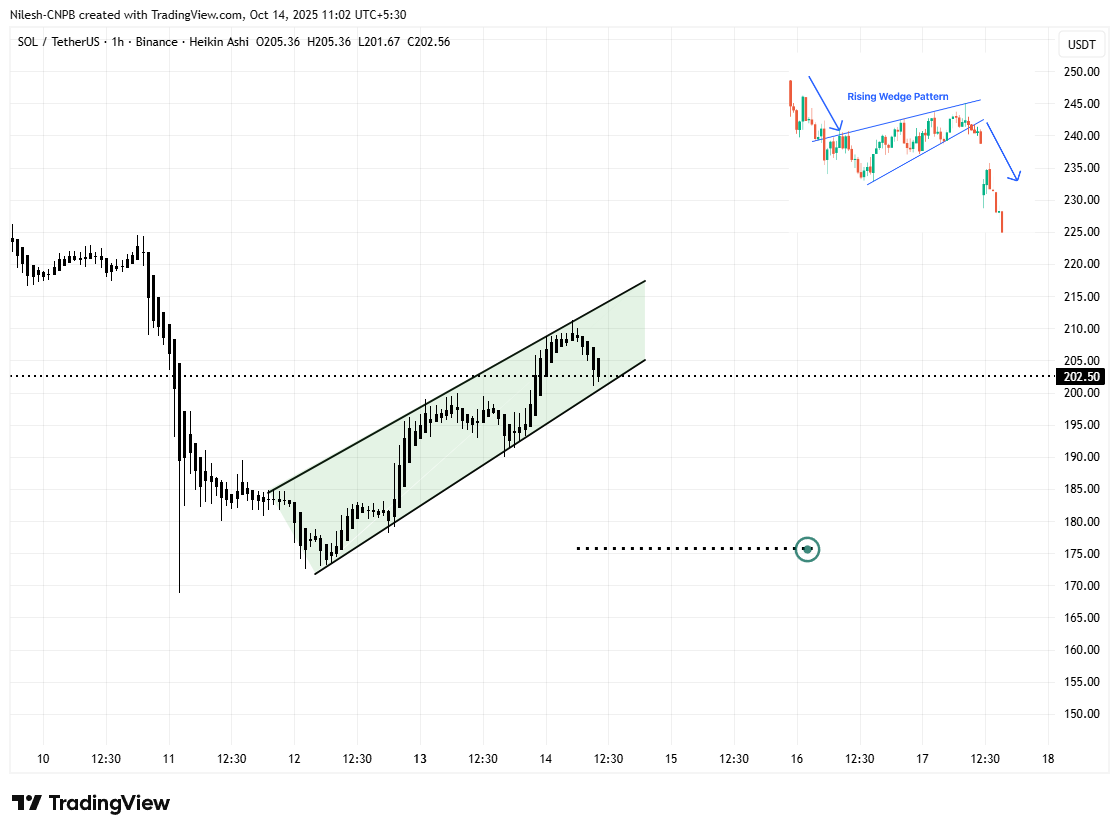 Solana (SOL) 1H Chart/Coinsprobe (Source: Tradingview)
This zone has acted as a dynamic support level in recent sessions, helping the bulls maintain control. However, a clean break below this line could signal a shift in market sentiment — from recovery to weakness.
What’s Next for SOL?
At the time of writing, SOL trades near $202, sitting right on the key support area. If bulls manage to hold above the $200 zone, a short-term rebound remains possible, potentially lifting prices back toward $218, the wedge’s upper resistance.
On the other hand, a decisive breakdown below the support trendline would confirm the failure of the rising wedge — often followed by accelerated downside momentum. In that case, SOL could slide toward the technical target around $175.8, aligning with previous demand zones seen earlier this month.
The next few trading sessions will likely determine whether Solana can maintain its short-term uptrend or if the wedge pattern plays out to the downside.