Date: Wed, Oct 15, 2025 | 01:25 AM GMT
The cryptocurrency market is once again leaning lower after showing early signs of recovery on Monday that took Ethereum (ETH) to a high of $4,292, before sliding back to around $4,100, marking a 3% intraday decline.
However, beneath this short-term weakness, ETH’s latest chart structure is showing an encouraging sign — a potential bullish reversal pattern that could set the stage for a stronger move ahead.
 Source: Coinmarketcap
Bump-and-Run Reversal (BARR) Pattern in Play
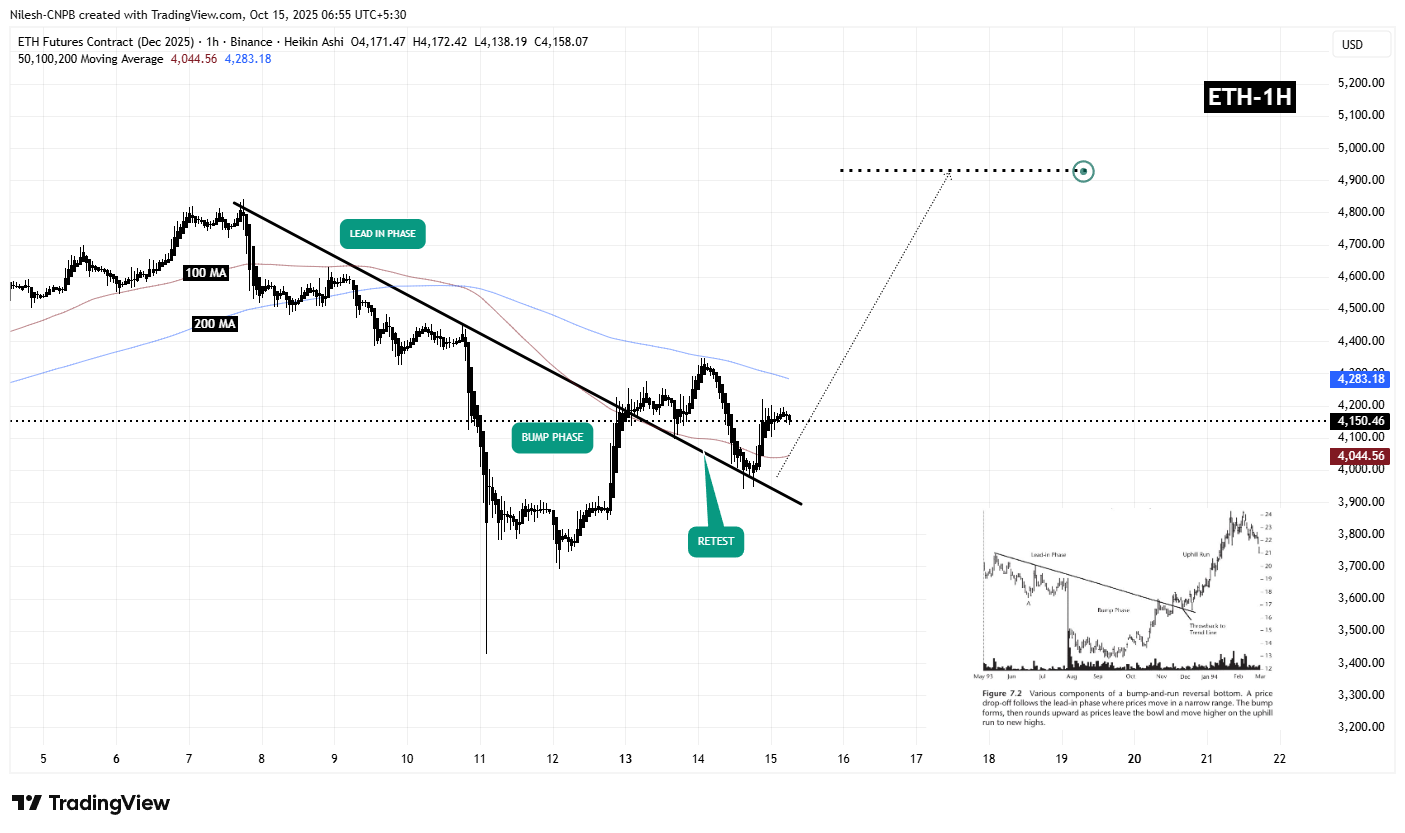
On the 1-hour chart, Ethereum appears to be forming a Bump-and-Run Reversal (BARR) pattern — a rare but powerful setup that often indicates the end of a bearish trend and the beginning of a new upward phase.
The Lead-in Phase began after ETH faced rejection from its descending resistance line near $4,841, triggering a decline that eventually bottomed out at $3,426, forming the Bump Phase. From that low, the price rebounded sharply, breaking through the long-standing downtrend resistance before pulling back for a throwback retest — a typical move that validates the breakout strength.
 Ethereum (ETH) 1H Chart/Coinsprobe (Source: Tradingview)
At the time of writing, ETH trades above $4,100, holding just above its 100-hour moving average (MA) at $4,044, which has emerged as a key dynamic support area. This zone remains crucial for sustaining the bullish setup.
What’s Next for ETH?
If ETH maintains support above the 100-hour MA and successfully reclaims the 200-hour MA near $4,283, it could enter the Uphill Run Phase of the BARR pattern — the stage often associated with accelerated upside momentum.
Technical projections suggest that this move could propel ETH toward the $4,931 region, implying a potential 18% gain from current levels if momentum continues to build.
However, a breakdown below the 100-hour MA could temporarily delay the bullish scenario, potentially leading to a short-term retest of lower supports. Still, as long as the overall BARR structure remains intact, the broader bias leans toward the upside.