
XRP Price Eyes Key Upside Break – Can Bulls Finally Regain Control?

XRP price started a fresh increase above $2.50. The price is now showing positive signs and could aim for more gains above the $2.620 level.
- XRP price is attempting a recovery wave above the $2.50 zone.
- The price is now trading above $2.50 and the 100-hourly Simple Moving Average.
- There is a key bearish trend line forming with resistance at $2.60 on the hourly chart of the XRP/USD pair (data source from Kraken).
- The pair could start a fresh surge if it clears the $2.60 resistance.
XRP Price Set To Surge?
XRP price found support and started a strong recovery wave above $2.220, like Bitcoin and Ethereum. The price was able to climb above the $2.320 and $2.40 levels to enter a positive zone.
The bulls were able to push the price above the 61.8% Fib retracement level of the downward move from the $3.05 swing high to the $1.40 swing low. However, the bears are still active near the $2.60 and $2.620 levels. Besides, there is a key bearish trend line forming with resistance at $2.60 on the hourly chart of the XRP/USD pair.
The price is now trading above $2.50 and the 100-hourly Simple Moving Average. If there is a fresh upward move, the price might face resistance near the $2.550 level.
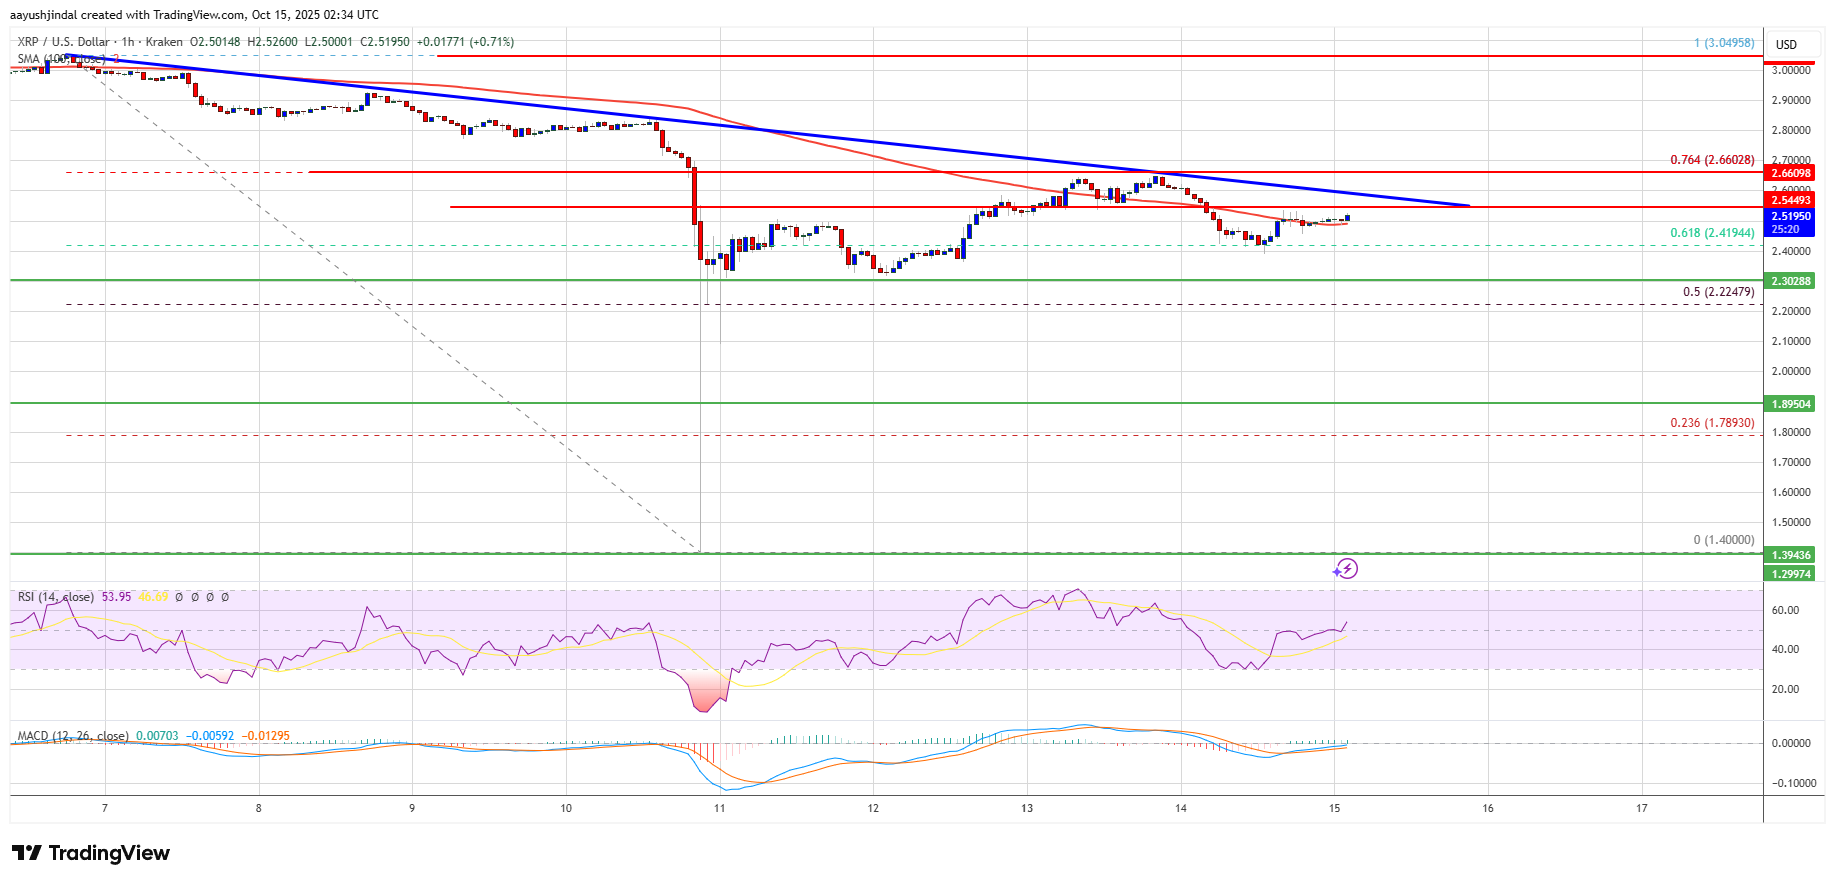
The first major resistance is near the $2.60 level and the trend line. The main hurdle could be near the 76.4% Fib retracement level of the downward move from the $3.05 swing high to the $1.40 swing low at $2.660. A clear move above the $2.660 resistance might send the price toward the $2.720 resistance. Any more gains might send the price toward the $2.750 resistance. The next major hurdle for the bulls might be near $2.80.
Another Drop?
If XRP fails to clear the $2.60 resistance zone, it could start a fresh decline. Initial support on the downside is near the $2.50 level. The next major support is near the $2.420 level.
If there is a downside break and a close below the $2.420 level, the price might continue to decline toward $2.320. The next major support sits near the $2.250 zone, below which the price could continue lower toward $2.20.
Technical Indicators
Hourly MACD – The MACD for XRP/USD is now gaining pace in the bullish zone.
Hourly RSI (Relative Strength Index) – The RSI for XRP/USD is now above the 50 level.
Major Support Levels – $2.50 and $2.420.
Major Resistance Levels – $2.60 and $2.660.
Disclaimer: The content of this article solely reflects the author's opinion and does not represent the platform in any capacity. This article is not intended to serve as a reference for making investment decisions.
You may also like
VeChain Slides 8.3%: Is This a Healthy Correction or a Bigger Warning Sign?
Stablecoin supply has stalled in 2026, but payments rose by 45% to $480B: Report
The most dangerous divergence in U.S. stocks: ordinary stocks have already plummeted, how much longer can AI giants hold on?
Significantly tightened financial conditions are heavily impacting ordinary stocks in the US stock market, with the median S&P 500 constituent falling 15% from its peak and the equity risk premium dropping below zero. Rising US Treasury yields and oil prices have pushed the financial conditions index sharply higher, resulting in a severe deterioration in breadth beneath the apparent calm of the index. Market divergence is intensifying, raising the core uncertainty of whether ordinary stocks will catch up or the index will converge downward.

Will APT’s price clear $0.87 after Aptos’s launch of Block-STM v2 upgrade?

Crypto prices
More


