Bitget App
Trade smarter
Buy cryptoMarketsTradeFuturesStocksEarnInstitutionAI & More
Bonk (BONK) To Surge Further? Key Harmonic Pattern Signals Potential Upside Move

Bonk (BONK) To Surge Further? Key Harmonic Pattern Signals Potential Upside Move

CoinsProbeCoinsProbe2025/10/21 18:42
By:Nilesh Hembade

Date: Mon, Oct 20, 2025 | 11:35 AM GMT

The cryptocurrency market is starting the new week on a bullish note after last week’s choppy momentum. Both Bitcoin (BTC) and Ethereum (ETH) are trading higher, gaining over 2% each, which has helped lift sentiment across major memecoins , including Bonk (BONK).

BONK has climbed more than 5% today, extending its upward momentum as a key harmonic pattern on its chart signals that the rally could still have more room to grow.

Bonk (BONK) To Surge Further? Key Harmonic Pattern Signals Potential Upside Move image 0 Source: Coinmarketcap

Harmonic Pattern Hints at Potential Upside

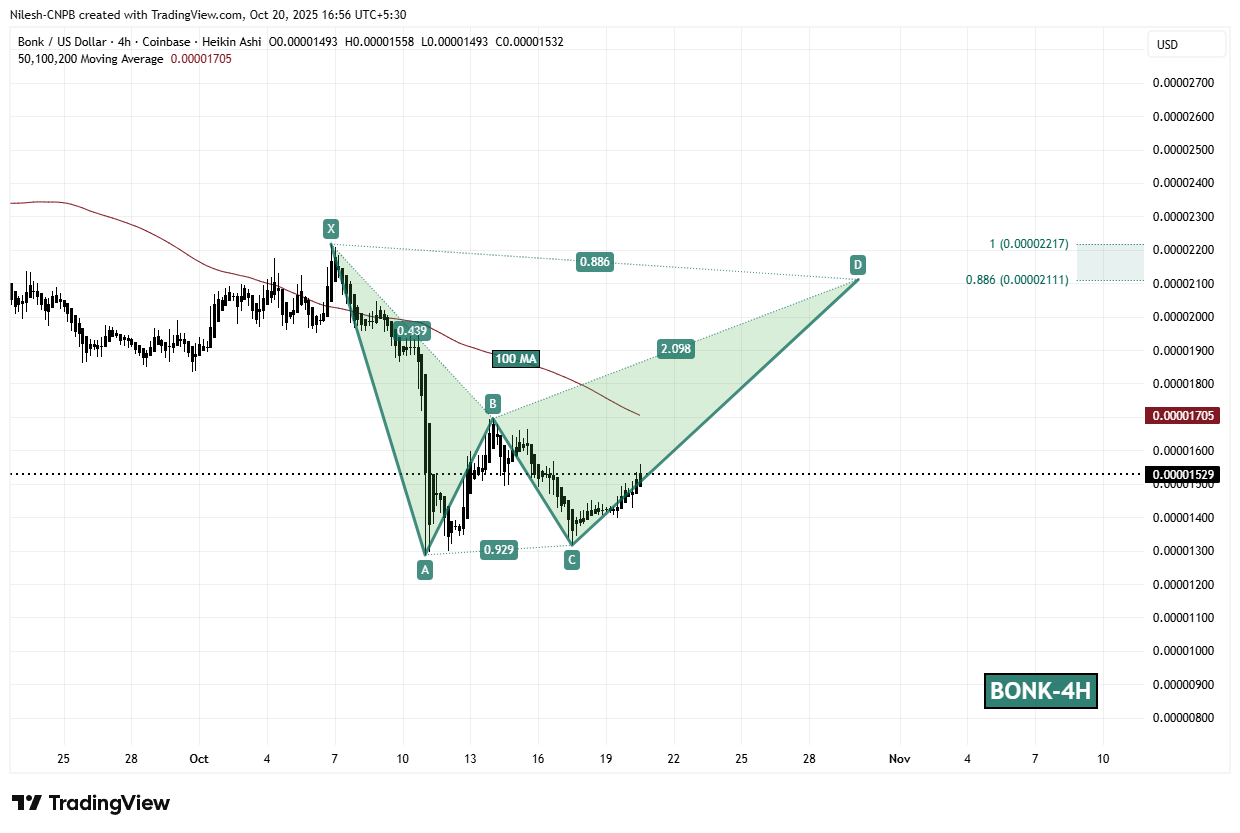
On the 4-hour chart, Bonk (BONK) appears to be forming a Bearish Bat harmonic pattern. Despite the “bearish” name, the structure often experiences a strong bullish leg during its final phase (CD leg) before completing near the Potential Reversal Zone (PRZ).

The pattern originated at Point X near $0.00002217, followed by a sharp correction to Point A, a rebound to Point B, and a secondary pullback to Point C around $0.00001316. From that low, BONK has started to recover steadily and is currently trading near $0.00001529, showing early signs of strengthening momentum.
Bonk (BONK) To Surge Further? Key Harmonic Pattern Signals Potential Upside Move image 1 Bonk (BONK) 4H Chart/Coinsprobe (Source: Tradingview)

Importantly, BONK is now positioned just below its 100-hour moving average (MA) at $0.00001705, which serves as a critical breakout level. A confirmed breakout above this line could flip resistance into support, potentially accelerating the next bullish leg toward the PRZ.

What’s Next for BONK?

If buyers manage to hold the support near $0.00001465 and push prices above the 100-hour MA, the Bat pattern projects a potential rally toward the PRZ zone between $0.00002111 and $0.00002217 — representing an upside of around 45% from the current price.

These levels correspond to the 0.886 and 1.0 Fibonacci extensions, which are often key completion points for harmonic structures. Historically, such setups tend to see strong momentum until these targets are reached.

However, if BONK fails to maintain support within the CD leg, the pattern’s bullish outlook could lose strength, opening the door for short-term correction before another rebound attempt.

0
0

Disclaimer: The content of this article solely reflects the author's opinion and does not represent the platform in any capacity. This article is not intended to serve as a reference for making investment decisions.

Understand the market, then trade.
Bitget offers one-stop trading for cryptocurrencies, stocks, and gold.
Trade now!

You may also like

CoreWeave, the "Eye of the Storm" in the Latest AI Crash amid "Double Blow to Stocks and Bonds"

CoreWeave's stock price plummeted 25% in a single week, with junk bond yields soaring to 15% and the default probability exceeding 60%, triggering a financing crisis in AI infrastructure. This "double whammy" in both stocks and bonds has led to an 11% drop in the Philadelphia Semiconductor Index and the Nasdaq 100 experiencing its worst weekly performance of the year. Market participants warn that this marks a turning point in AI hype credit pricing—the high-leverage, heavy-debt expansion model is now facing a severe test amid elevated interest rates.

华尔街见闻•2026/10/18 04:11
CoreWeave, the "Eye of the Storm" in the Latest AI Crash amid "Double Blow to Stocks and Bonds"

Bank of America’s Hartnett, who accurately predicted major declines: “Sell signal” is over, investors will "return to tech stocks in mid-November”, the key lies in “chip prices”

Bank of America’s “sell signal” has ended, but this is by no means a call to bottom fish. Currently, the AI financing gap is widening, and technology stocks are extremely crowded. Strategists warn that the key to whether technology stocks can rebound in November depends entirely on “semiconductor prices.” In the short term, it is advised to avoid technology stocks, maintain a defensive stance, and position in small caps and REITs.

华尔街见闻•2026/10/18 03:21
Bank of America’s Hartnett, who accurately predicted major declines: “Sell signal” is over, investors will "return to tech stocks in mid-November”, the key lies in “chip prices”