
Pro Trader Gives Bitcoin Warning Based On 1970s Soybean Crash

Veteran trader Peter Brandt warns Bitcoin is forming a bearish "broadening top" pattern, suggesting a potential crash to $60,000. Another analyst quickly countered, predicting a bullish breakout instead.
A debate is heating up among top market analysts. This follows veteran cryptocurrency trader Peter Brandt’s suggestion that Bitcoin’s recent price action is dangerously mirroring a pattern observed in the 1970s soybean market.
This pattern indicates the current cycle may have already reached its peak.
The Rare ‘Broadening Top’ Formation
Peter Brandt is a veteran trader and chart analyst who has been active in the futures and forex markets since 1975. He has gained notoriety over decades for accurate trend predictions and trades across commodities, futures, and crypto markets.
Brandt became particularly famous for his pattern analysis, which precisely predicted the Bitcoin price action in 2017–2018.
In a recent X post, Brandt pointed out that Bitcoin is currently forming a rare “broadening top” pattern on its charts. This technical analysis formation is characterized by two trend lines that increasingly diverge.
This action creates a megaphone shape as the price swings within a wider range.
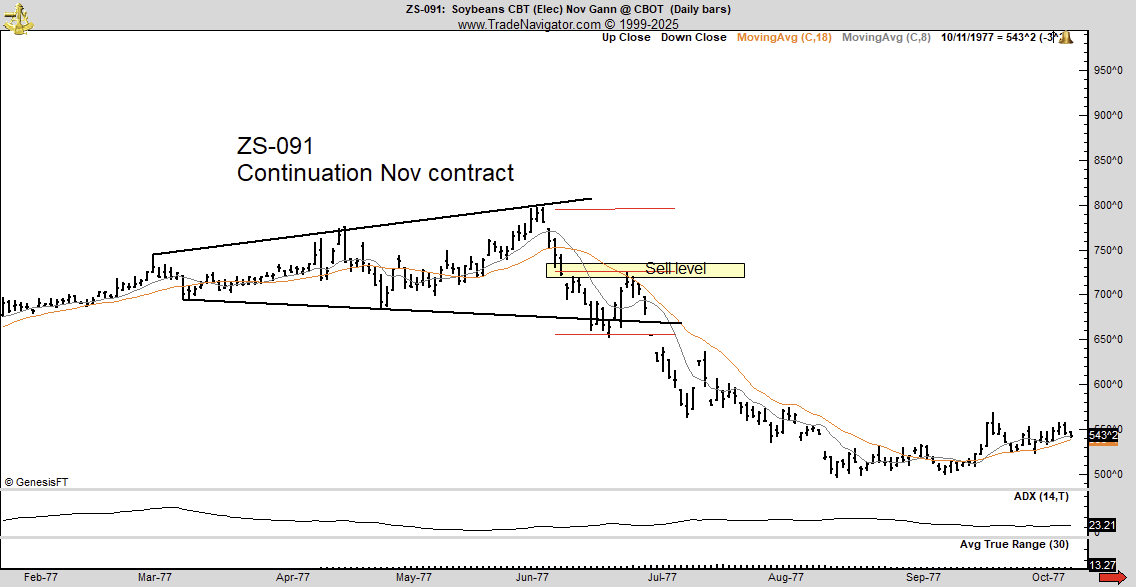 1970s Soybeans CBT Chart. Source: PeterLBrandt
This pattern is typically recognized as a reversal signal appearing at the climax of an upward trend. The completion of the pattern often results in a sharp breakdown below the lower trend line, signaling the start of a major bearish reversal.
Historical Parallel to Soybeans and MSTR Risk
Brandt drew a direct historical comparison to justify his caution: “In 1977 Soybeans formed a broadening top and then declined 50% in value. Bitcoin today is forming a similar pattern.”
He highlighted a significant market risk: “A 50% decline in $BTC will put $MSTR underwater.” The possibility of a collapse in MicroStrategy (MSTR) triggering a downward spiral in Bitcoin is a known, though unusual, scenario. This is given MSTR’s massive BTC holdings.
Contrary to market expectations, Brandt concluded that a massive bull run may not materialize this cycle. Instead, he suggested that Bitcoin could correct down to $60,000.
Counterpoint: Is It a Bullish ‘Wedge’?
Brandt’s bearish thesis did not go unchallenged. Prominent chart analyst immediately rebutted Brandt’s post.
The analyst agreed that both the 1970s soybean chart and the 2025 Bitcoin chart display a broadening structure, which is characterized by increasingly higher highs and lower lows. However, he argued that the underlying trend differentiates their meaning.
He contended that the soybean chart was an Ascending Megaphone pattern formed during an uptrend. In contrast, Bitcoin’s price is currently situated within a Descending Broadening Wedge.
This wedge, he noted, is a structure where downside selling pressure weakens as energy accumulates, ultimately foreshadowing a bullish breakout.
Disclaimer: The content of this article solely reflects the author's opinion and does not represent the platform in any capacity. This article is not intended to serve as a reference for making investment decisions.
You may also like

CoreWeave, the "Eye of the Storm" in the Latest AI Crash amid "Double Blow to Stocks and Bonds"
CoreWeave's stock price plummeted 25% in a single week, with junk bond yields soaring to 15% and the default probability exceeding 60%, triggering a financing crisis in AI infrastructure. This "double whammy" in both stocks and bonds has led to an 11% drop in the Philadelphia Semiconductor Index and the Nasdaq 100 experiencing its worst weekly performance of the year. Market participants warn that this marks a turning point in AI hype credit pricing—the high-leverage, heavy-debt expansion model is now facing a severe test amid elevated interest rates.

Japan taps Chainlink’s CCIP to accelerate tokenization — Details

Bank of America’s Hartnett, who accurately predicted major declines: “Sell signal” is over, investors will "return to tech stocks in mid-November”, the key lies in “chip prices”
Bank of America’s “sell signal” has ended, but this is by no means a call to bottom fish. Currently, the AI financing gap is widening, and technology stocks are extremely crowded. Strategists warn that the key to whether technology stocks can rebound in November depends entirely on “semiconductor prices.” In the short term, it is advised to avoid technology stocks, maintain a defensive stance, and position in small caps and REITs.

Crypto prices
More


