
Is Bitcoin Headed for a Crash Below $100K? ‘Grand Daddy’ Volume Indicator Hits Lowest Since April

This is a daily analysis by CoinDesk analyst and Chartered Market Technician Omkar Godbole.
Bitcoin BTC$108,033.92 has held above $100,000 for four consecutive months, a price stability that can be interpreted as the formation of a solid base for the next upward move.
However, a major volume indicator, used to confirm price trends, shows a contrasting signal.
The indicator under consideration is the On-Balance Volume (OBV), described as the "grand daddy" of all volume indices by Charles D. Kirkpatrick II and Julie R. Dahlquist in their book Technical Analysis: The Complete Resource for Financial Market Technicians."
On-Balance Volume (OBV) is a running total of an asset’s trading volume that adds volume to the tally on days when the price closes higher and subtracts when the price closes lower.
The OBV indicator is widely used to confirm price trends and can also serve as an early warning signal for an eventual resolution of a price range.
"When prices are in a trading range and the OBV breaks its own support or resistance, the break often indicates the direction in which the price breakout will occur. Therefore, it gives an early warning of breakout direction from a price pattern," Kirkpatrick II and Dahlquist said in their book.
That's precisely what BTC's OBV has done, warning of a deeper sell-off in BTC's price.
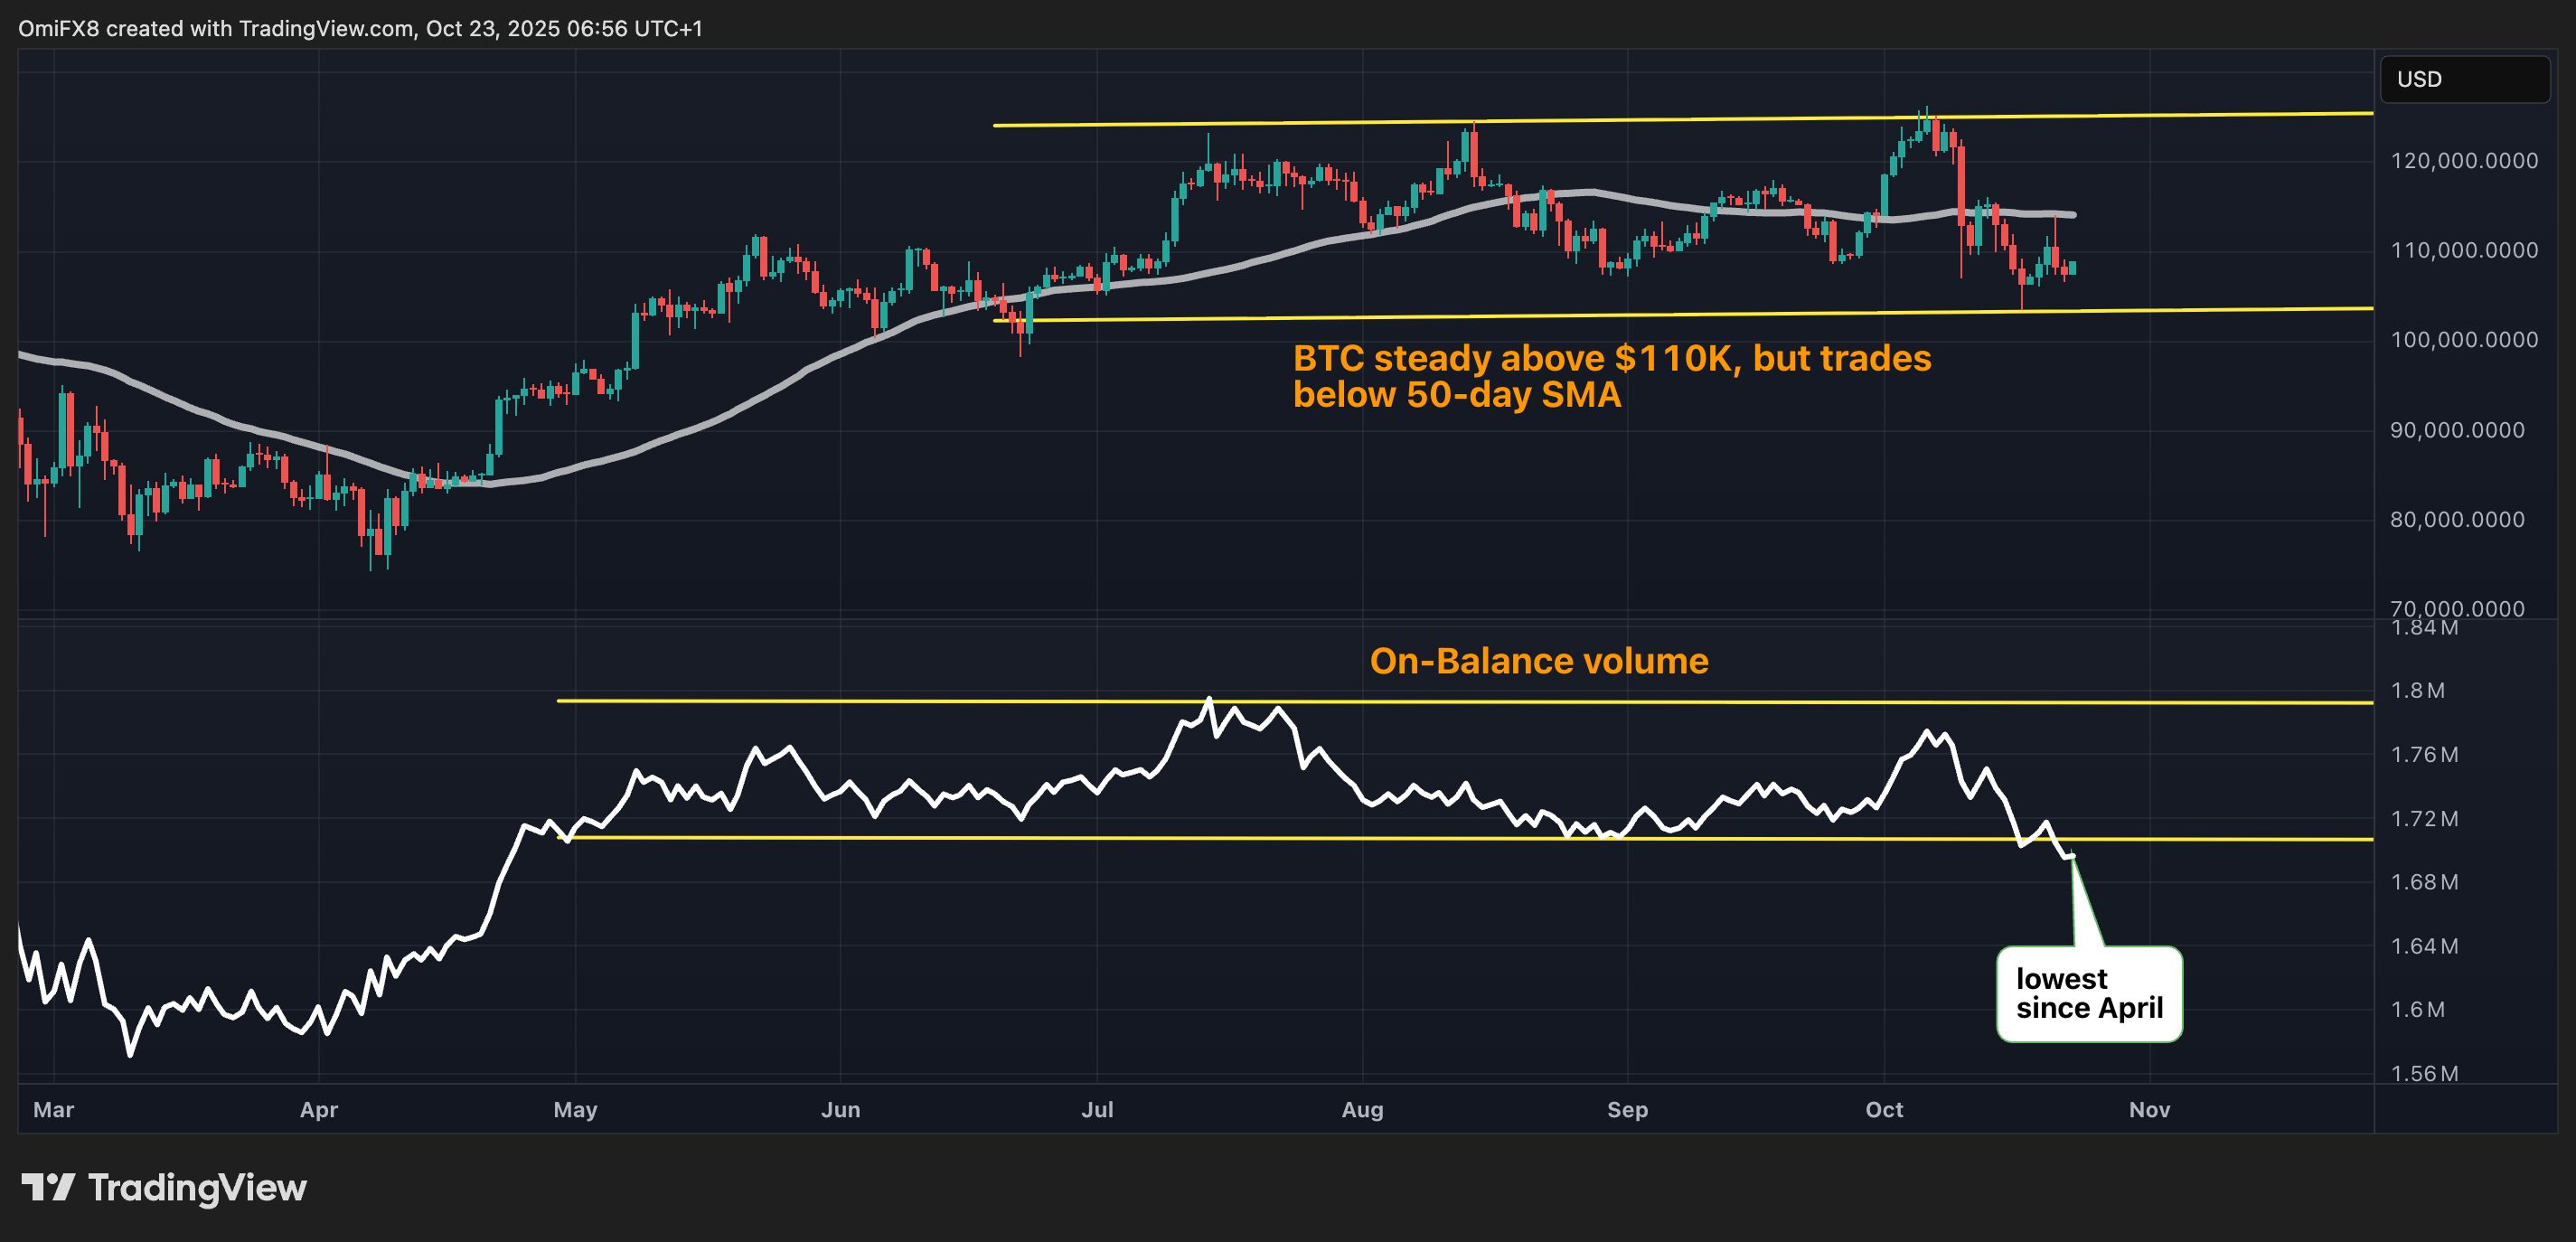
While bitcoin’s price remains rangebound above $100,000, the OBV indicator has broken below its own range, dropping to levels last seen on April 24, when BTC was trading around $94,000.
This decline in OBV signals underlying weakness, suggesting that demand may be faltering and prices could soon slide below $100,000. The bearish message is consistent with macro factors, which also favor an extended price drop.
Other momentum indicators, such as the MACD histogram, are flashing bearish signals. The indicator is forming deeper bars below the zero line on the weekly chart, indicating strengthening downside momentum.
Key levels
As of writing, bitcoin is trading well below its 50-day simple moving average (SMA), a key short-term trend metric, and is dangerously close to critical support near $107,300.
This support is marked by intraday lows in late August from which the last upward move began. A break below this level would shift focus to the June 22 low around $99,225.
On the upside, the 50-day SMA remains the level to beat for the bulls.
Disclaimer: The content of this article solely reflects the author's opinion and does not represent the platform in any capacity. This article is not intended to serve as a reference for making investment decisions.
You may also like

CoreWeave, the "Eye of the Storm" in the Latest AI Crash amid "Double Blow to Stocks and Bonds"
CoreWeave's stock price plummeted 25% in a single week, with junk bond yields soaring to 15% and the default probability exceeding 60%, triggering a financing crisis in AI infrastructure. This "double whammy" in both stocks and bonds has led to an 11% drop in the Philadelphia Semiconductor Index and the Nasdaq 100 experiencing its worst weekly performance of the year. Market participants warn that this marks a turning point in AI hype credit pricing—the high-leverage, heavy-debt expansion model is now facing a severe test amid elevated interest rates.

Japan taps Chainlink’s CCIP to accelerate tokenization — Details

Bank of America’s Hartnett, who accurately predicted major declines: “Sell signal” is over, investors will "return to tech stocks in mid-November”, the key lies in “chip prices”
Bank of America’s “sell signal” has ended, but this is by no means a call to bottom fish. Currently, the AI financing gap is widening, and technology stocks are extremely crowded. Strategists warn that the key to whether technology stocks can rebound in November depends entirely on “semiconductor prices.” In the short term, it is advised to avoid technology stocks, maintain a defensive stance, and position in small caps and REITs.

Crypto prices
More


