
Bitcoin Breakdown Begins — On-Chain Signals Say “Brace for $104K”

Bitcoin's price weakness increases the odds of a $104K retest, Glassnode reports. Top buyers are capitulating after the price failed to reclaim their average cost basis since July.
Bitcoin’s price showed renewed weakness, dipping nearly 4% on Monday. According to a detailed on-chain analysis, this raises the possibility of a test of the crucial $104,000 support level.
On-chain data platform Glassnode posted the analysis on X on Tuesday, observing a persistent failure in upward momentum. The firm pointed out, “Since July, BTC has consistently failed to reclaim the cost basis of the top buyers’ supply.”
Key Support and Resistance Levels
The analysis utilizes the “Top Buyers Cost Basis Distribution” metric. This metric maps Bitcoin’s price against the average acquisition price (Cost Basis) for different cohorts of the market’s most recent and highest-price purchasers.
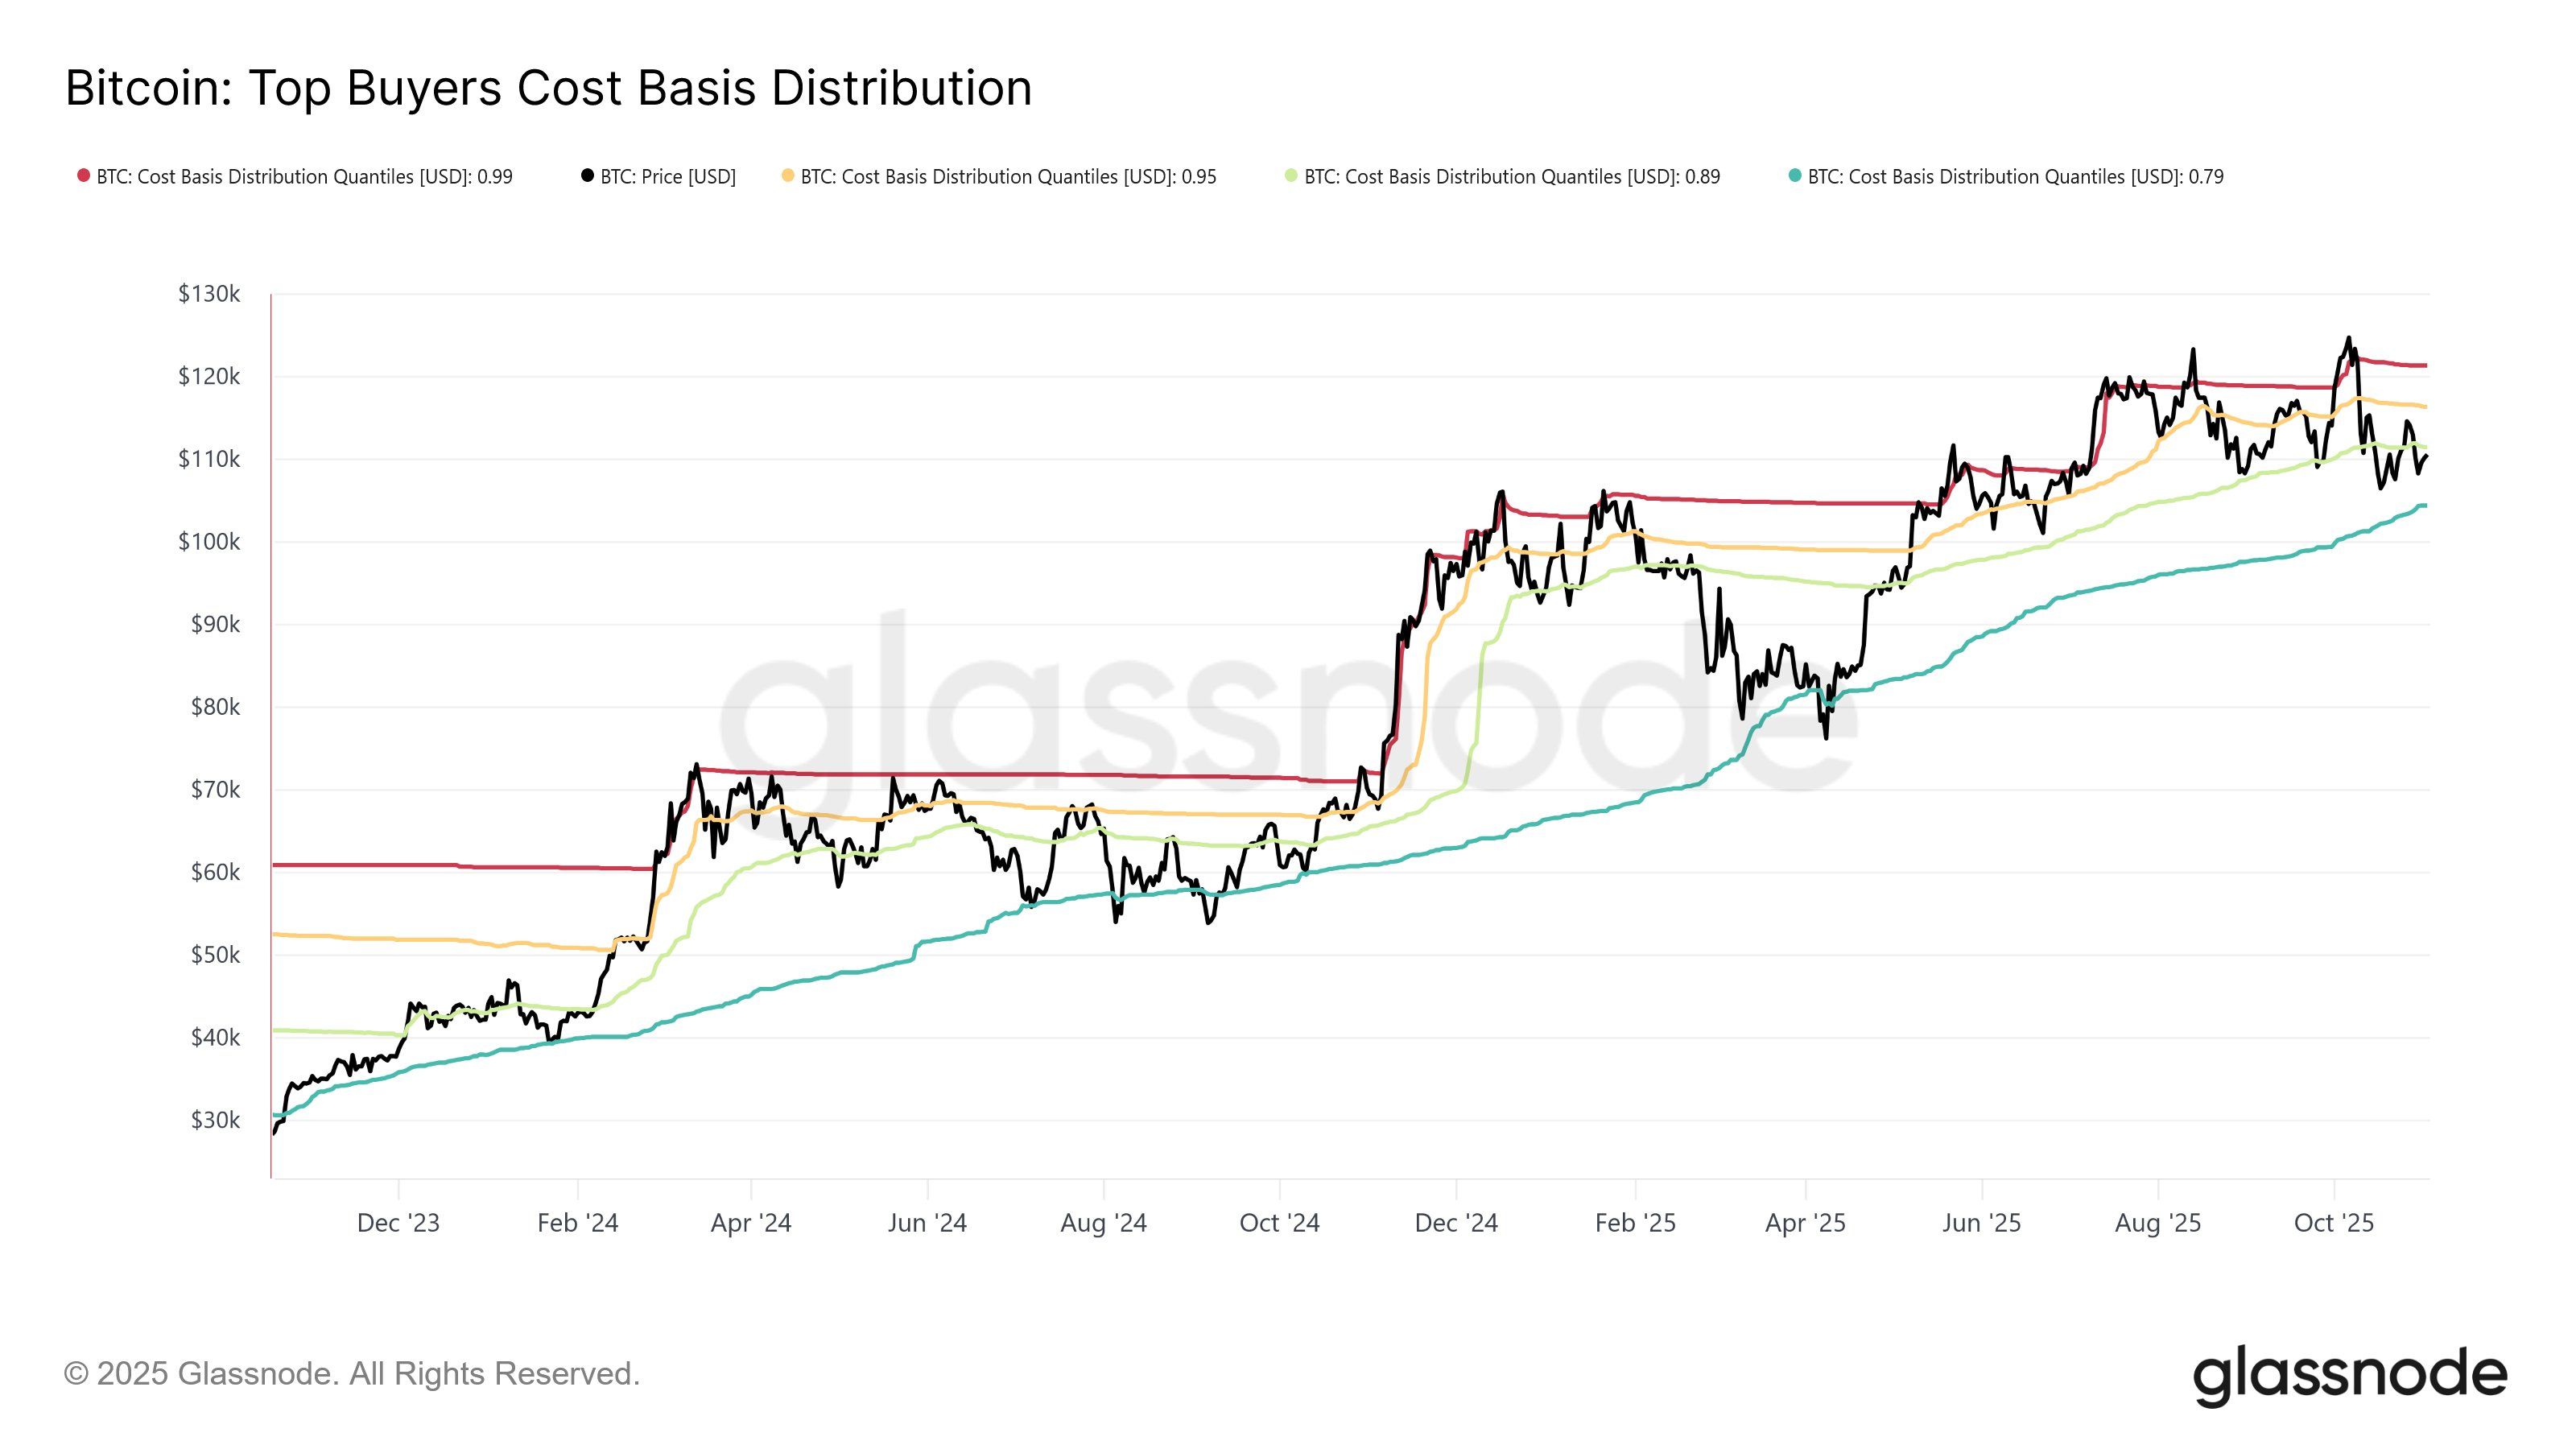 Top Buyers Cost Basis Distribution. Source: Glassnode
The metric defines several key cost basis quantiles:
- 0.99 Quantile (Red): This represents the average purchase price of the most recent, highest-priced buyers. It is considered the cost basis for the latest entrants.
- 0.95 Quantile (Yellow): The average cost basis for the top 5% of recent buyers.
- 0.89 Quantile (Green): The average cost basis for the top 11% of recent buyers.
- 0.79 Quantile (Mint): The average cost basis for the top 21% of recent buyers, often viewed as the general ‘recent buyer average cost.’
These lines act as significant support and resistance levels. When the price falls below a line, the corresponding buyer group enters an Unrealized Loss state, increasing the potential for sell pressure and capitulation.
Momentum Shifts Post-October Crash
Glassnode noted that the price movement confirms a gradual decrease in upward momentum since July. The BTC price hit a new all-time high on August 14. Following this, the market successfully held the green line (0.89 Quantile) as support for nearly two months during the ensuing correction.
However, a deeper correction that pierced the green line followed the rally to a subsequent all-time high in early October. The 0.89 Quantile, now near $111,000, has flipped from support to resistance. This shift was confirmed when Bitcoin failed to hold the level after a small surge to $110,800 on Monday, 0:00 UTC.
This structural weakening leads to a bearish projection. Glassnode warned, “This increases the odds of a retest of the 0.8-quantile cost basis (~$104K) as top buyers capitulate, transferring coins to stronger hands.”
Around 09:30 UTC, Bitcoin briefly dipped below the $104,000 level before recovering, signaling yet another test of key support.
Disclaimer: The content of this article solely reflects the author's opinion and does not represent the platform in any capacity. This article is not intended to serve as a reference for making investment decisions.
You may also like
AI bubble alarm rings across Wall Street! Oaktree Capital's Marks disagrees: The market hasn't reached its most dangerous moment yet, and investors are not completely oblivious to risks.
Although investors are displaying typical FOMO (fear of missing out) sentiment regarding further gains in tech stocks, the market continues to draw comparisons between the current situation and past bubbles, indicating that investors are not unaware of the risks.

Barclays: Dual restrictions of physical and capital, data center growth will slow significantly in 2027!
Barclays' latest report reveals that the global data center construction boom is approaching a turning point—the year-on-year growth rate of new capacity will plummet from over 100% in 2026 to about 35% in 2027, and stabilize by 2028. Facing both physical constraints and tightened financing, hyperscale cloud providers will absorb more than 60% of new capacity, while the risk of project suspension for small and medium developers will sharply increase.
Bitcoin and Solana test key support as NEAR and HYPE face selling pressure
AI Capital Flow Chart: Nvidia Takes 690 Billion, Remaining 499 Companies Share 340 Billion
Morgan Stanley has released its first comprehensive overview of AI capital expenditure: In 2027, among $1.58 trillion in spending by hyperscale cloud service providers, Nvidia alone will take 67%, while the remaining 499 S&P component companies will collectively receive only $339 billion. A more hidden risk lies in over $1.1 trillion of "off-balance-sheet leases," which are essentially disguised debt. 2027 is predicted to have the largest free cash flow shortfall, and the risks of both volume and price declines are being severely underestimated by the market.

Crypto prices
More


