Bitget App
Trade smarter
Buy cryptoMarketsTradeFuturesStocksEarnInstitutionAI & More
Altcoin Setups Look Strong: Buy the Dip or Catch a Falling Knife?

Altcoin Setups Look Strong: Buy the Dip or Catch a Falling Knife?

CryptodailyCryptodaily2025/11/03 16:00
By:Laurie Dunn

As Bitcoin enters the second day of a nasty reversal, more than 9% down and over $10,000 lost so far, what chance do the altcoins have?  Many have taken a far worse beating. That said, a few of the top altcoins like $ETH and $SOL have hit excellent buying opportunities. Are they a buy, or is the crypto market just too volatile right now? 

Is the total market cap of the altcoins a cause for concern?
Altcoin Setups Look Strong: Buy the Dip or Catch a Falling Knife? image 0

Source: TradingView

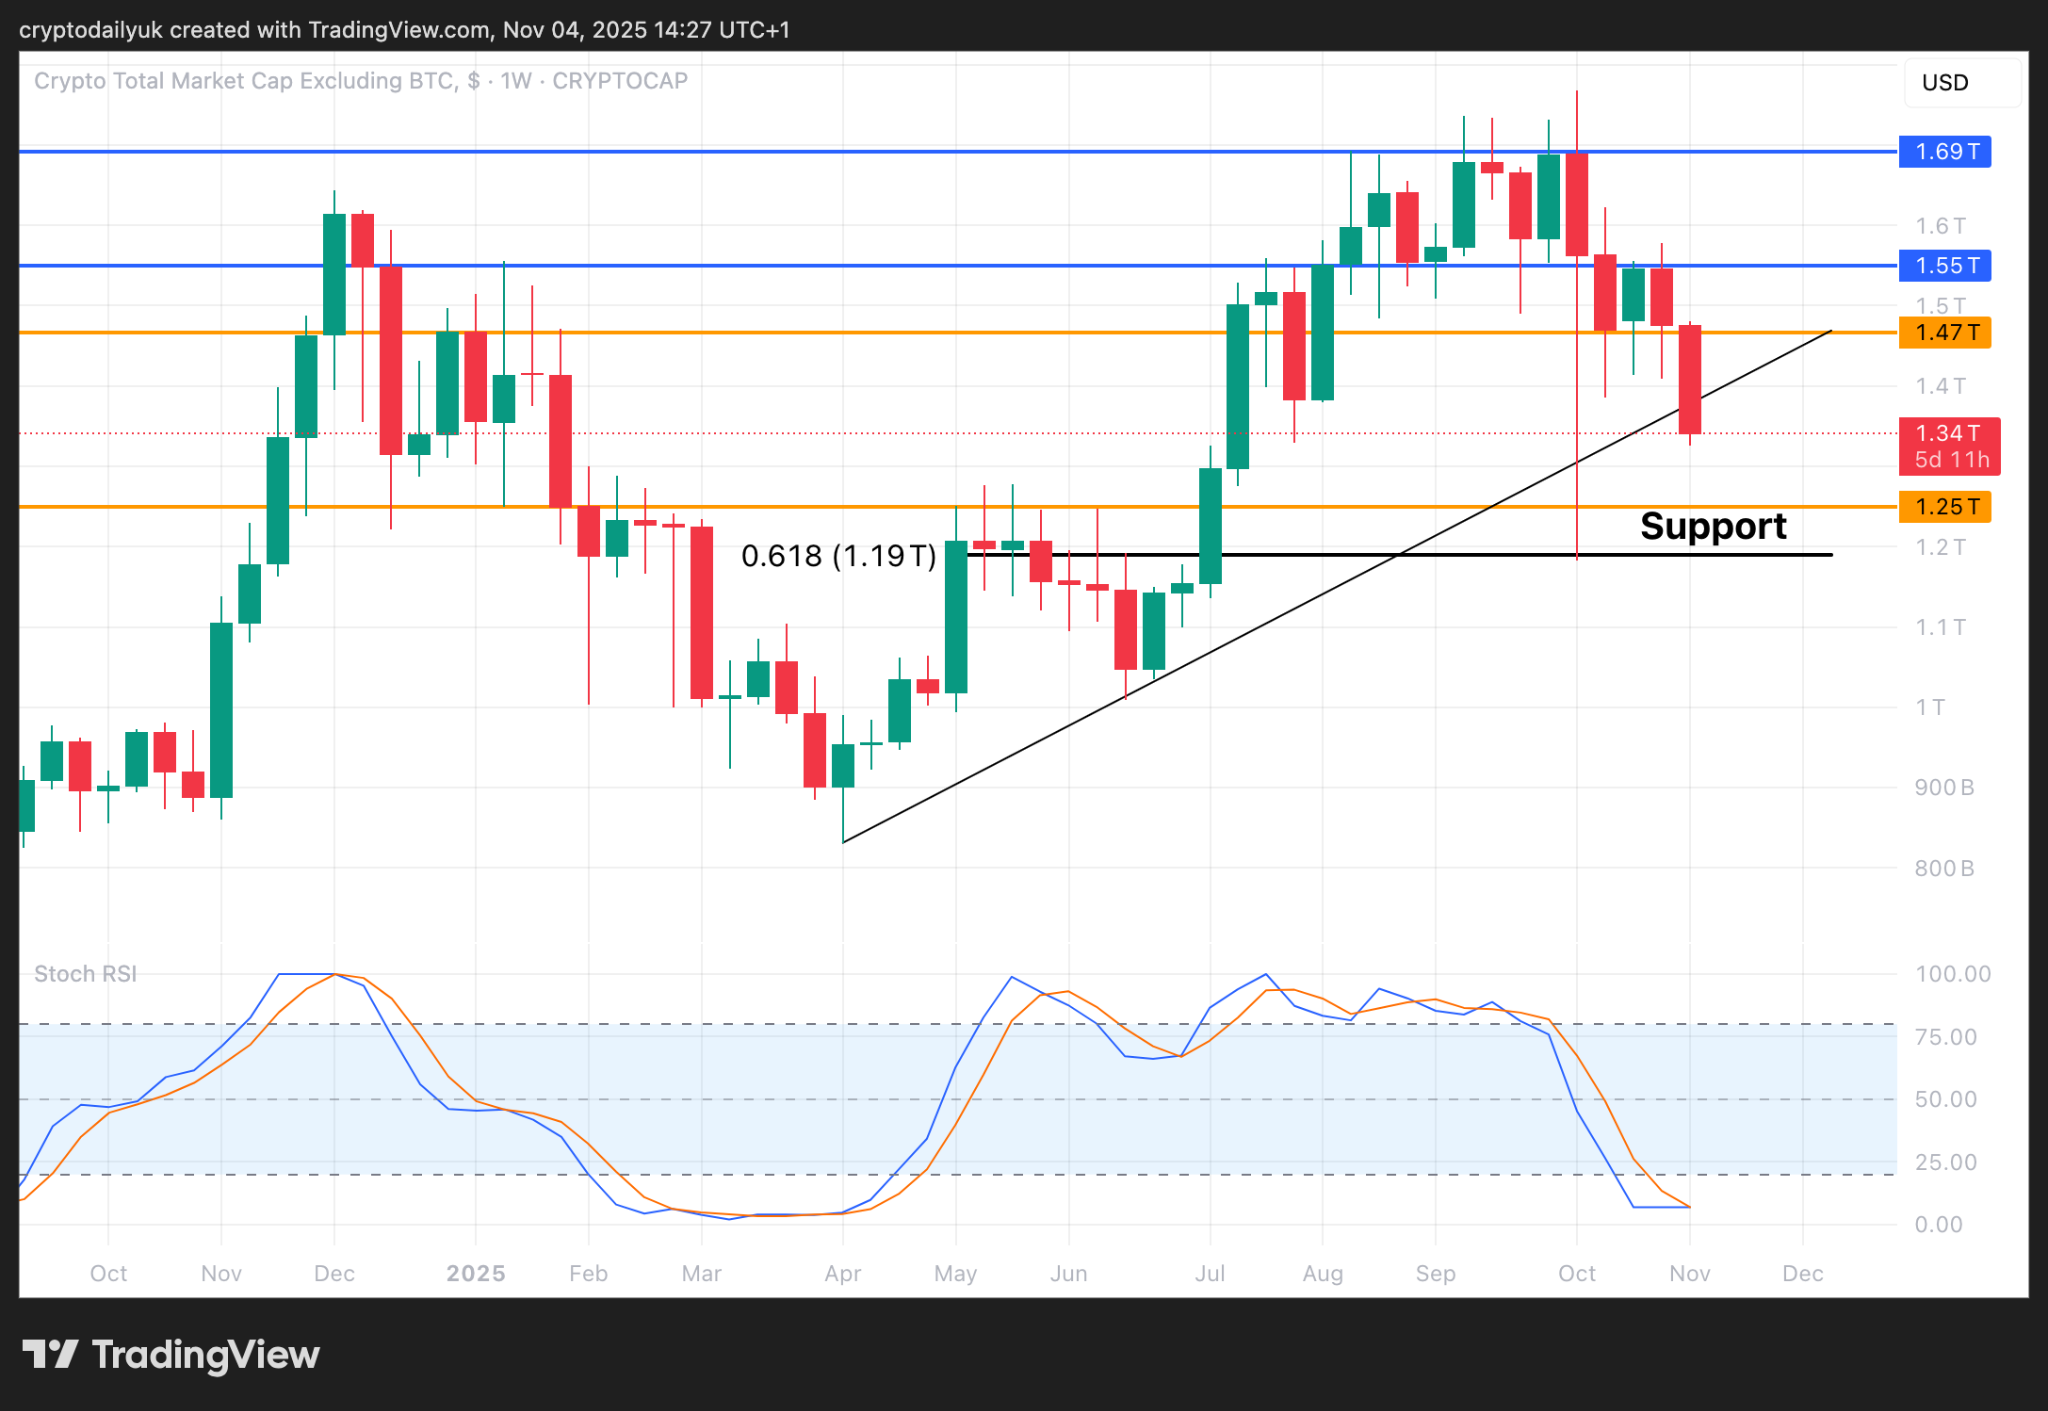
Looking at the weekly Total2 chart (market capitalization of all altcoins, excluding Bitcoin) it can be seen that yes, there is a horrible red candle that is poking down through the ascending trendline. It has broken through the $1.47 trillion horizontal support, and could be heading down to the $1.25 trillion support level, or even the 0.618 Fibonacci at $1.19 trillion.

However, there are two major factors to bear in mind here. The week is only two days old, and the Stochastic RSI indicators at the bottom of the chart are ripe for a turn back to the upside. 

When zoomed into the shorter term time frames things can become very disheartening. It may not be too much longer before the current tall red candle becomes a lot shorter, and at least moves back above the trendline. Also, look at the last time the Stochastic RSI indicators turned back up from the bottom - a $933 billion move was the result.

$ETH bull flag still valid
Altcoin Setups Look Strong: Buy the Dip or Catch a Falling Knife? image 1

Source: TradingView

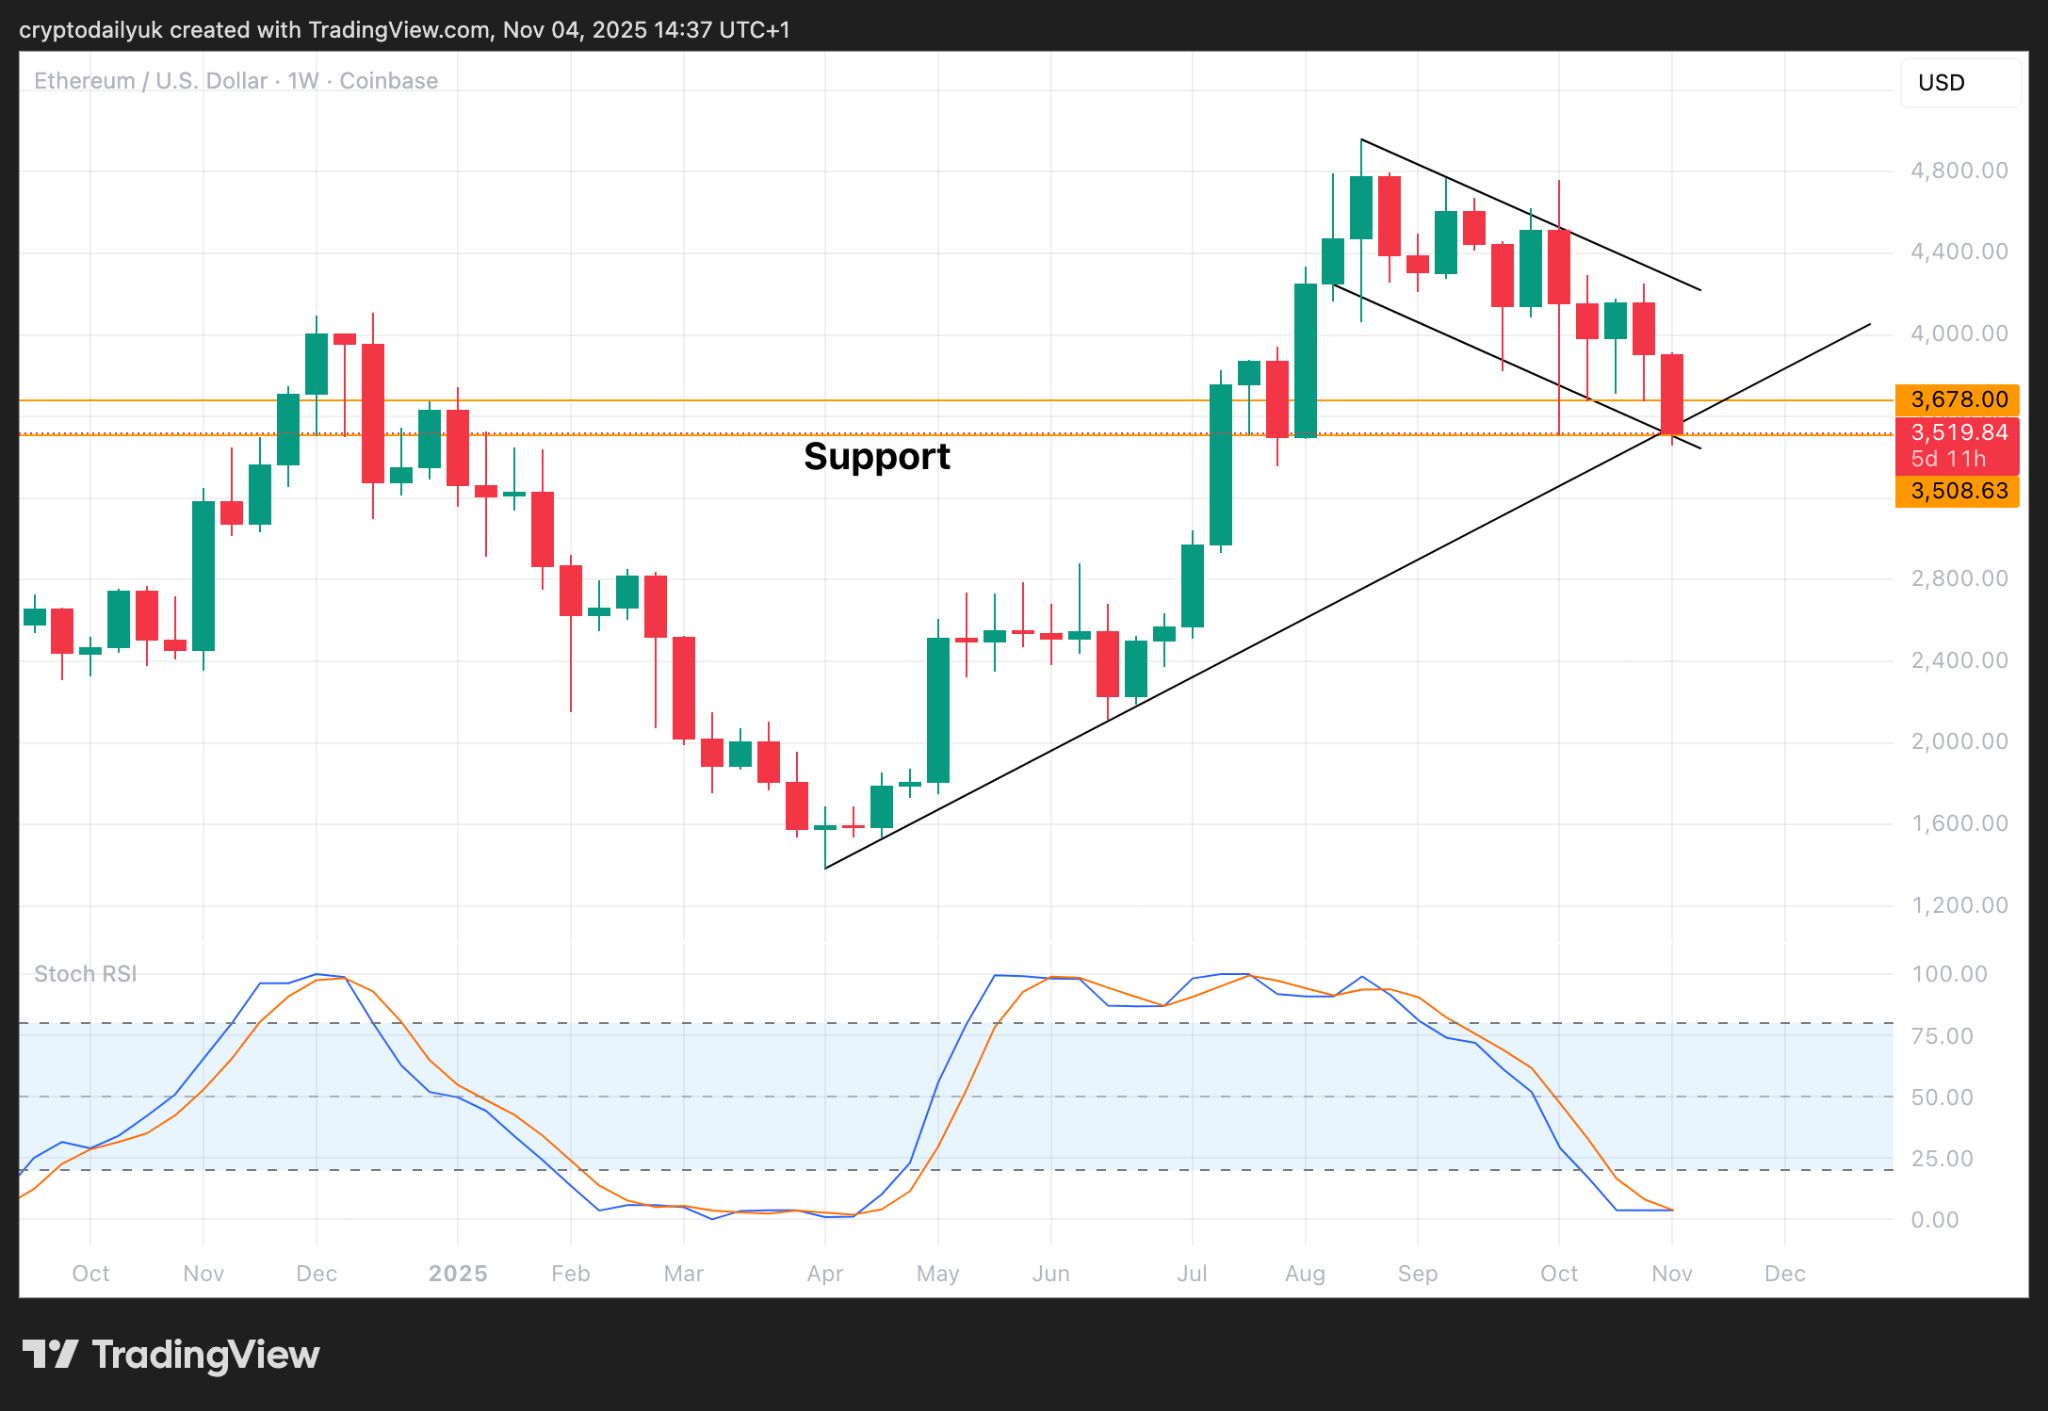
$ETH has lost around 10% of its value since the beginning of the week, and it’s only Tuesday. Once again, in the short time frame things look really scary. Zoom out into the weekly time frame and things look perfectly normal. 

Of course, if the price were to fall through the ascending trendline, and out of the bottom of the bull flag, things could potentially get nasty very quickly. However, the price is sitting on a very strong horizontal support level at $3,500, and although the ascending trendline is beginning to see a candle body push through it, there is the rest of the week for the price to regain its balance.

Again, the Stochastic RSI at the bottom of the chart suggests that a rally back to the upside may not be far away. Looking back at this setup in a few weeks time, it might be seen that this was the retest of the bottom of the bull flag + strong horizontal support, before the rally that took $ETH back to new all-time highs.

$260 future target for $SOL?
Altcoin Setups Look Strong: Buy the Dip or Catch a Falling Knife? image 2

Source: TradingView

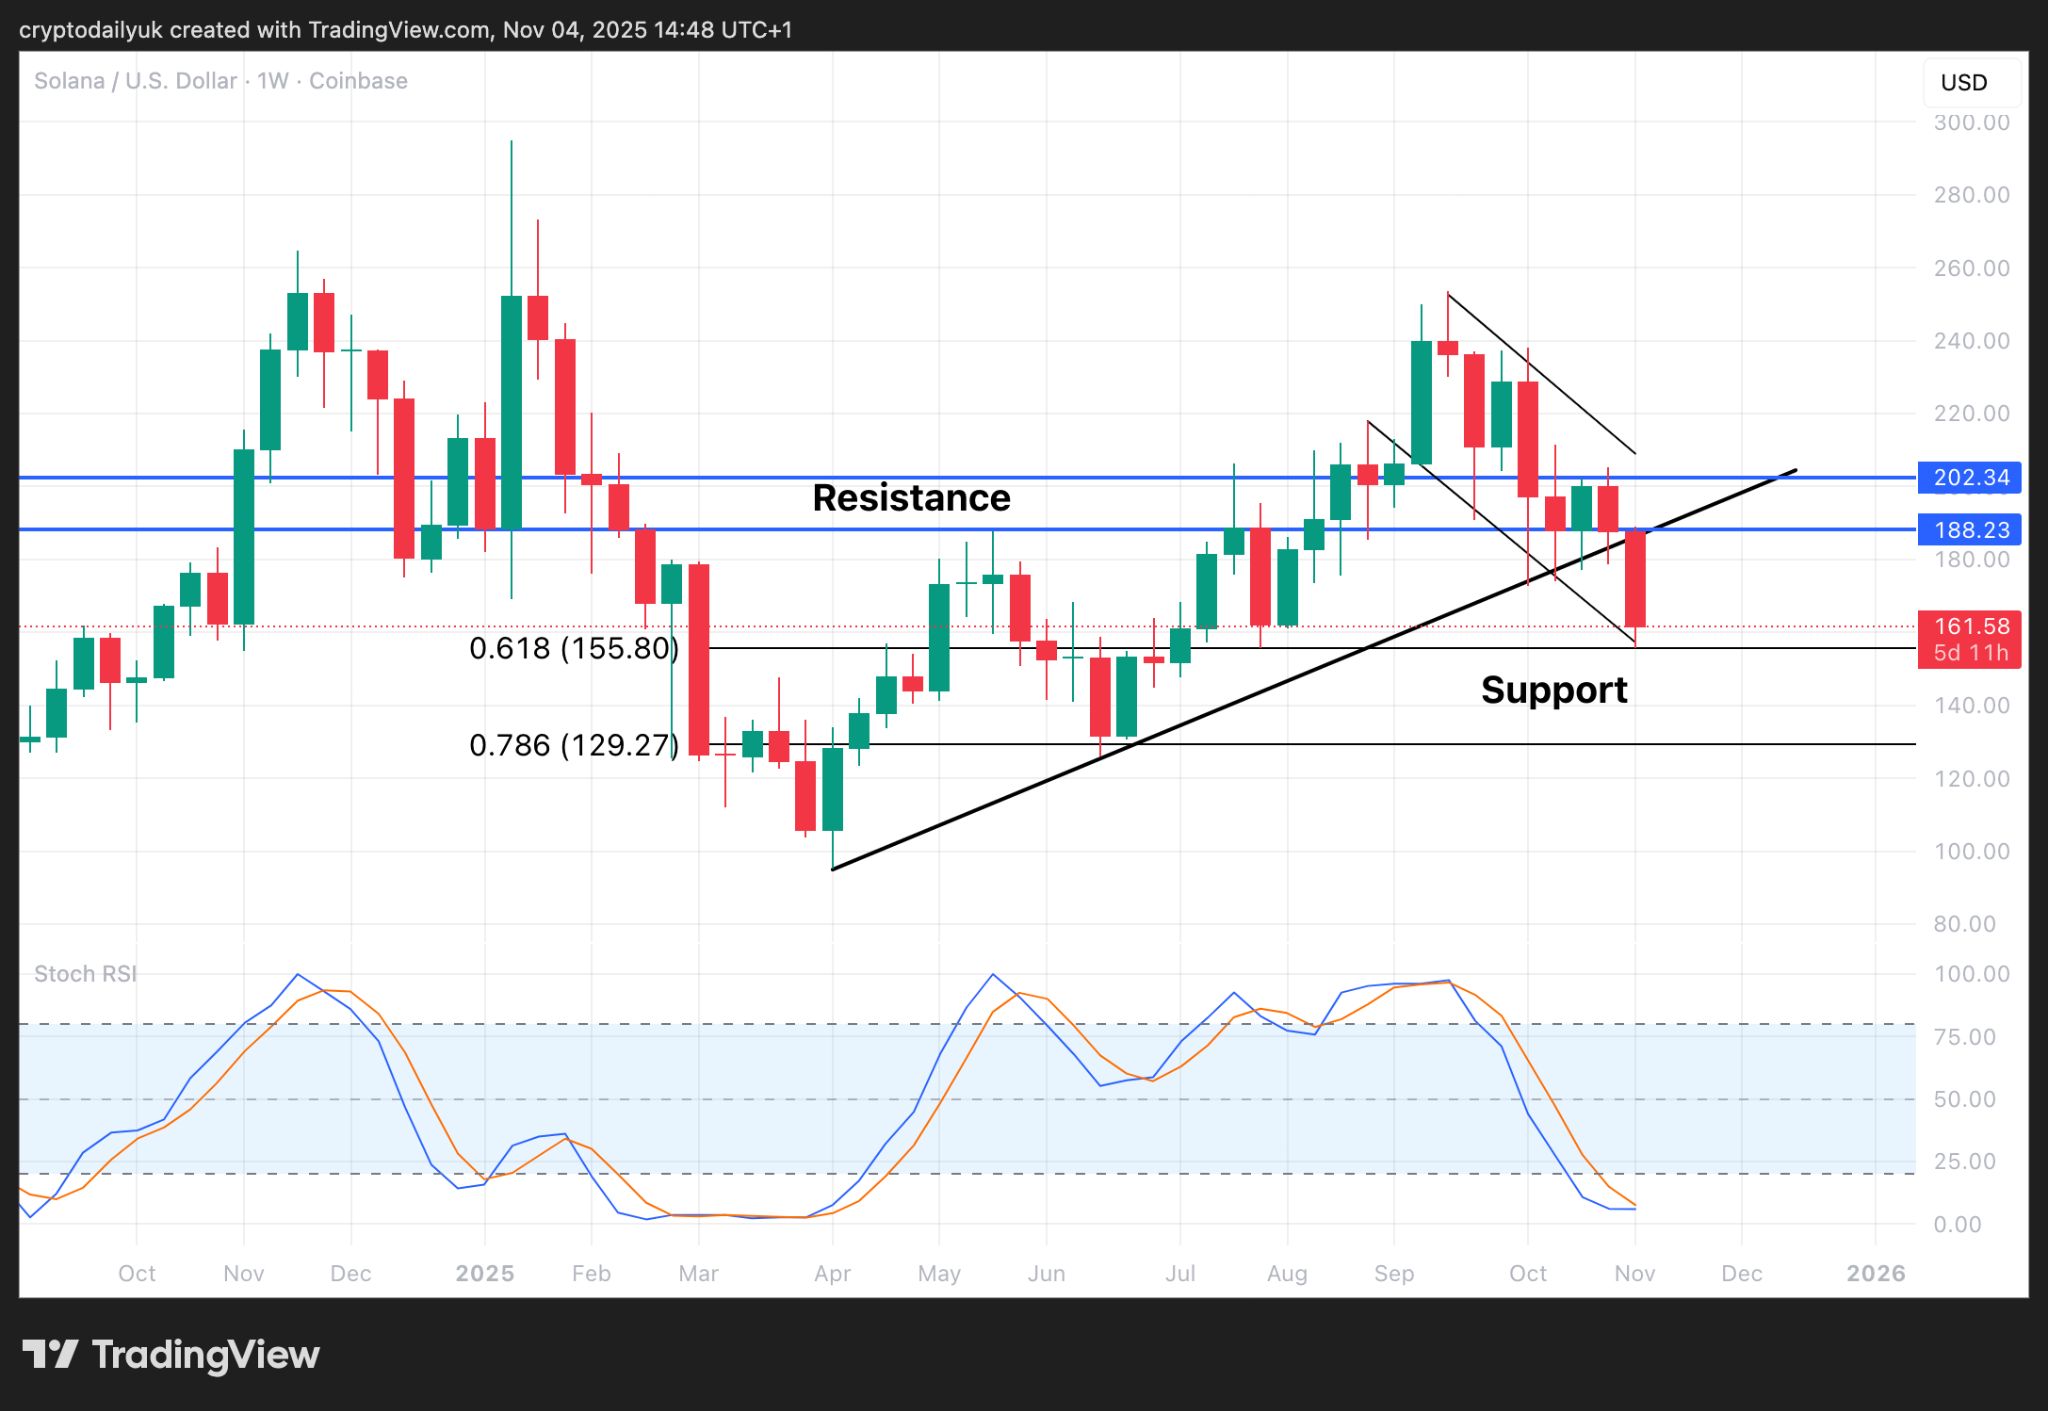
Viewing the $SOL price in the weekly time frame the setup looks fairly similar. The angle on the previous price rally may not be as steep, and the bull flag has probably been invalidated, but even taken as a descending channel, the price would get back to around $260 if the measured move played out. 

It can be seen that the price has been down to retest the 0.618 Fibonacci - always a great place for a bounce, and yet again, the Stochastic RSI indicators are perhaps getting ready for a cross back to the upside. 

All in all, while many investors are maybe chewing their fingernails in desperation, the actual big picture for the altcoins is not giving huge cause for concern. Yes, if prices do continue to melt down, especially if the traditional stock markets also start to slide, it could become quite different, and quite rapidly. That said, we haven’t got there yet. 

0
0

Disclaimer: The content of this article solely reflects the author's opinion and does not represent the platform in any capacity. This article is not intended to serve as a reference for making investment decisions.

Understand the market, then trade.
Bitget offers one-stop trading for cryptocurrencies, stocks, and gold.
Trade now!

You may also like

10-year Yield Plunges 17 Basis Points in One Week! AI Trading Turbulence Rekindles Safe-Haven Appeal of US Treasuries

AI trading has loosened, reactivating the safe-haven attribute of US Treasury bonds. Last week, the 10-year yield dropped 17 basis points in a single week, synchronizing with the decline in tech stocks—a phenomenon not seen since the tariff storm in April 2025. The unusually concentrated short positions amplified the bond market rally, and large-scale short-covering by CTA funds has also become a key driver in this round of bond rebound.

华尔街见闻•2026/10/19 02:51

From Digital Assets to Reshaping Financial Pipelines! BlackRock (BLK.US) Accelerates Integration of Tokenized Funds into the Core of Wall Street

Wall Street’s embrace of blockchain technology is moving beyond simply creating digital versions of stocks, bonds, and money market funds, aiming instead for a broader goal—to transform the way these assets circulate within the financial system.

智通财经•2026/10/19 02:32
From Digital Assets to Reshaping Financial Pipelines! BlackRock (BLK.US) Accelerates Integration of Tokenized Funds into the Core of Wall Street

AI bubble alarm rings across Wall Street! Oaktree Capital's Marks disagrees: The market hasn't reached its most dangerous moment yet, and investors are not completely oblivious to risks.

Although investors are displaying typical FOMO (fear of missing out) sentiment regarding further gains in tech stocks, the market continues to draw comparisons between the current situation and past bubbles, indicating that investors are not unaware of the risks.

智通财经•2026/10/19 01:26
AI bubble alarm rings across Wall Street! Oaktree Capital's Marks disagrees: The market hasn't reached its most dangerous moment yet, and investors are not completely oblivious to risks.

Barclays: Dual restrictions of physical and capital, data center growth will slow significantly in 2027!

Barclays' latest report reveals that the global data center construction boom is approaching a turning point—the year-on-year growth rate of new capacity will plummet from over 100% in 2026 to about 35% in 2027, and stabilize by 2028. Facing both physical constraints and tightened financing, hyperscale cloud providers will absorb more than 60% of new capacity, while the risk of project suspension for small and medium developers will sharply increase.

华尔街见闻•2026/10/19 01:26
Barclays: Dual restrictions of physical and capital, data center growth will slow significantly in 2027!