
Ethereum Crash Deepens: Can the $3K Line Hold or Will It Break Next?

The crypto market is in freefall , and Ethereum is one of the hardest hit.
Following Bitcoin’s sharp decline under $100K, $ETH plunged over 13% in a single day, wiping out weeks of gains and reigniting fears of a deeper bear trend.
Ethereum Price Crash Toward $3,000
$Ethereum crashed from around $3,600 to nearly $3,100, breaking several key support zones. The 200-day SMA at $3,370 has been breached, confirming a bearish trend continuation.
ETH/USD 1-day chart - TradingView
RSI has dropped to 43, indicating rising selling pressure but not yet fully oversold.
MACD remains in negative territory, with widening divergence — a clear sign that momentum is still heavily bearish.
Bitcoin Crash Triggered the Avalanche
Bitcoin’s breakdown below $100K acted like a domino effect across all markets.
Ethereum, BNB, Solana, Cardano, and Dogecoin all saw steep declines as liquidations exceeded $100 billion in 24h trading volume across top exchanges.
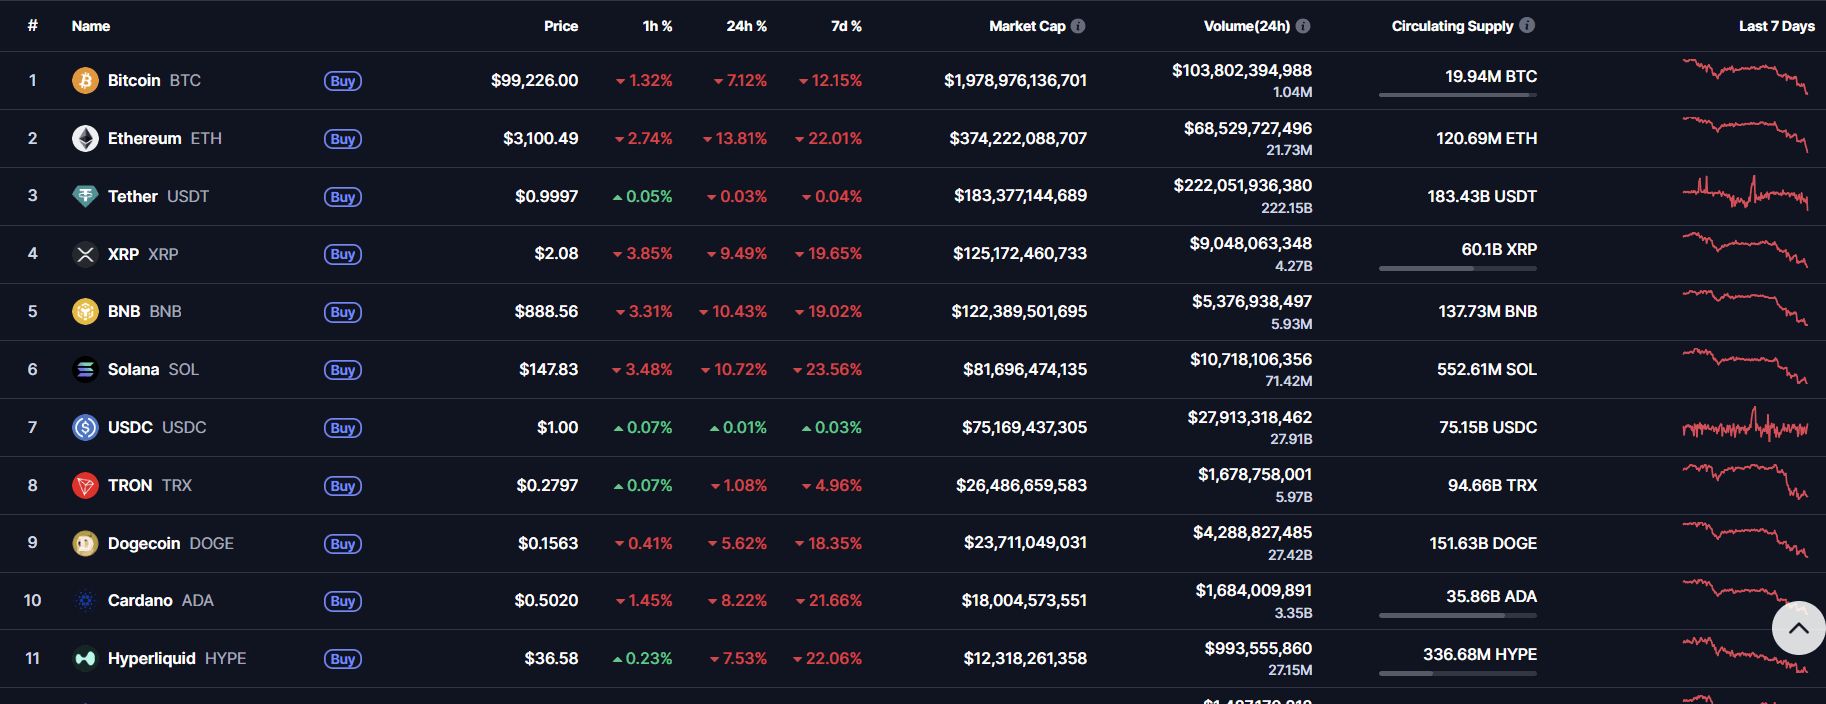
Solana dropped 23%, Cardano lost 21%, and BNB tumbled nearly 10%.
The entire crypto market capitalization has now fallen below $3.6 trillion.
Ethereum Price Prediction: Key Levels to Watch for ETH
If Ethereum fails to hold above the $3,000 mark, the next strong supports lie at $2,730 and $2,400.
A rebound may occur if BTC finds stability near $100K, potentially sending ETH back toward $3,500.
However, sentiment remains extremely bearish — and any short-term rally could face resistance near the $3,370–$3,800 range.
Will Ethereum Price Recover?
Both $Bitcoin and $Ethereum have entered dangerous territory.
While the RSI readings suggest short-term exhaustion among sellers, macro factors — including liquidations, investor fear, and risk-off sentiment — continue to weigh on the market.
Until $BTC reclaims $106K or $ETH climbs above $3,500, the crypto correction is far from over.
Disclaimer: The content of this article solely reflects the author's opinion and does not represent the platform in any capacity. This article is not intended to serve as a reference for making investment decisions.
You may also like
 VIPAI Asset Sell-Off and Selective Rotation in Crypto
1. Technology stocks fell sharply as investor interest shifted toward energy and selected defensive assets. From October 10 to 16, the Nasdaq 100 declined 5.49% and the S&P 500 fell 1.95%, while the Dow gained 0.67% and WTI crude rose 10.41%. BTC, ETH, and SOL declined 1.27%, 2.65%, and 4.44%, respectively. This week's technology earnings will be an important test of whether revenue growth, margins, and cash flow can justify current valuations. Better-than-expected results could help stabilize markets in the near term. 2. Crypto continues to see pockets of strong activity, but a broad-based altcoin season has yet to materialize. CoinMarketCap's (CMC) Altcoin Season Index stood at 54 as of the October 18 UTC daily observation, below the altcoin-season threshold of 75, while BTC dominance rose to 60.08%. Our proxy leverage ratio fluctuated between 4.00 and 4.07 during the week, showing no sustained increase and suggesting limited appetite for additional leverage. Meanwhile, as major exchanges expand access to traditional financial assets, the recent sell-off in AI-related equities could attract short-term speculative capital away from crypto. Such capital rotation could make it more difficult for a new altcoin season to take hold. 3. Papertrade's loss-to-mine model has generated significant interest across the crypto community. The protocol combines high-leverage derivatives trading with zero slippage and a mechanism that rewards trading losses with PAPER tokens. Across the eight complete UTC days from October 10 to 17, cumulative reported revenue reached approximately $56.08 million, including $51.90 million distributed to token holders. With growing participation from key opinion leaders (KOLs), Papertrade has reportedly ranked among the top three platforms by profitability in the broader market recently. Assets to watch: BTC, ETH, SOL, ARB, OP, SKHYNIX, SKHY, META, TSLA, LRCX, and SPCX. Key research priorities this week: Cash flow performance in technology earnings; the relative discount and holding costs of the two SK Hynix contracts; and U.S. initial jobless claims and PMI data. Weekly market data cover the period through October 16, while research information was verified through October 18. Observation periods are specified separately for each chart.

Why Bernstein Thinks the AI Stock Sell-Off Could Help Small Caps

Morgan Stanley Builds Crypto Lab to Test Stablecoins, Tokenization and DeFi at Scale

Top 4 Earnings Reports This Week: What Tesla, Meta, SpaceX, Netflix Must Show

Crypto prices
More


