
Which Altcoins Could Crash if Bitcoin Closes Below $100,000?

Bitcoin’s brief slip below $100,000 has renewed fears of a deeper correction, and some altcoins look especially vulnerable. These three highly correlated tokens — Bitcoin Cash, BNB, and Litecoin — have long moved almost in sync with Bitcoin. With dominance rising and large holders trimming exposure, they’re among the altcoins most likely to crash if Bitcoin falls further in the coming days.
Bitcoin briefly slipped below the $100,000 mark a few hours back, shaking market confidence and sparking fresh volatility. As traders assess the next move, attention is turning to the altcoins that could crash if Bitcoin falls further, given their tight price link with BTC.
With Bitcoin’s dominance climbing again, several highly correlated tokens are already flashing signs of weakness. These three coins often move in lockstep with Bitcoin — and if BTC slides deeper, their declines could quickly intensify.
Bitcoin Cash (BCH)
Bitcoin Cash could be one of the altcoins to crash if Bitcoi n falls, given its strong price link with BTC. Its 7-day Pearson correlation coefficient is 0.94, showing that BCH moves almost exactly in step with Bitcoin. The Pearson coefficient measures how closely two assets move together, with +1 meaning they move the same way and -1 meaning the opposite.
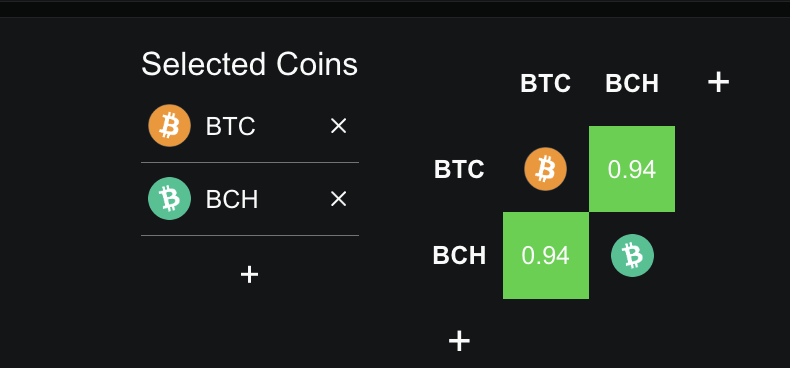 BCH-BTC 7-day Correlation:
Even over the past year, BCH has maintained a high 0.80 correlation, making it one of the most consistently linked assets to Bitcoin’s movements.
Want more token insights like this? Sign up for Editor Harsh Notariya’s Daily Crypto Newsletter here.
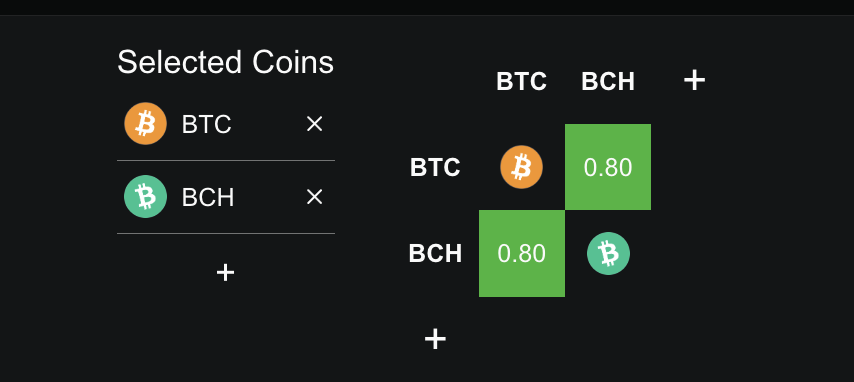 BCH-BTC Yearly Correlation:
That connection is already visible in recent price action. Over the past month, Bitcoin Cash has dropped 18.9%, while Bitcoin has fallen 18.1% — showing both are still moving in tandem. As Bitcoin dominance climbs above 60%, this tight correlation makes BCH especially vulnerable to any deeper Bitcoin decline.
Large holders — the 100,000 to 1 million BCH cohort, often considered whales — have been reducing positions since November 1, cutting their stash from 4.39 million to 4.34 million BCH, or roughly 50,000 coins (about $25 million).
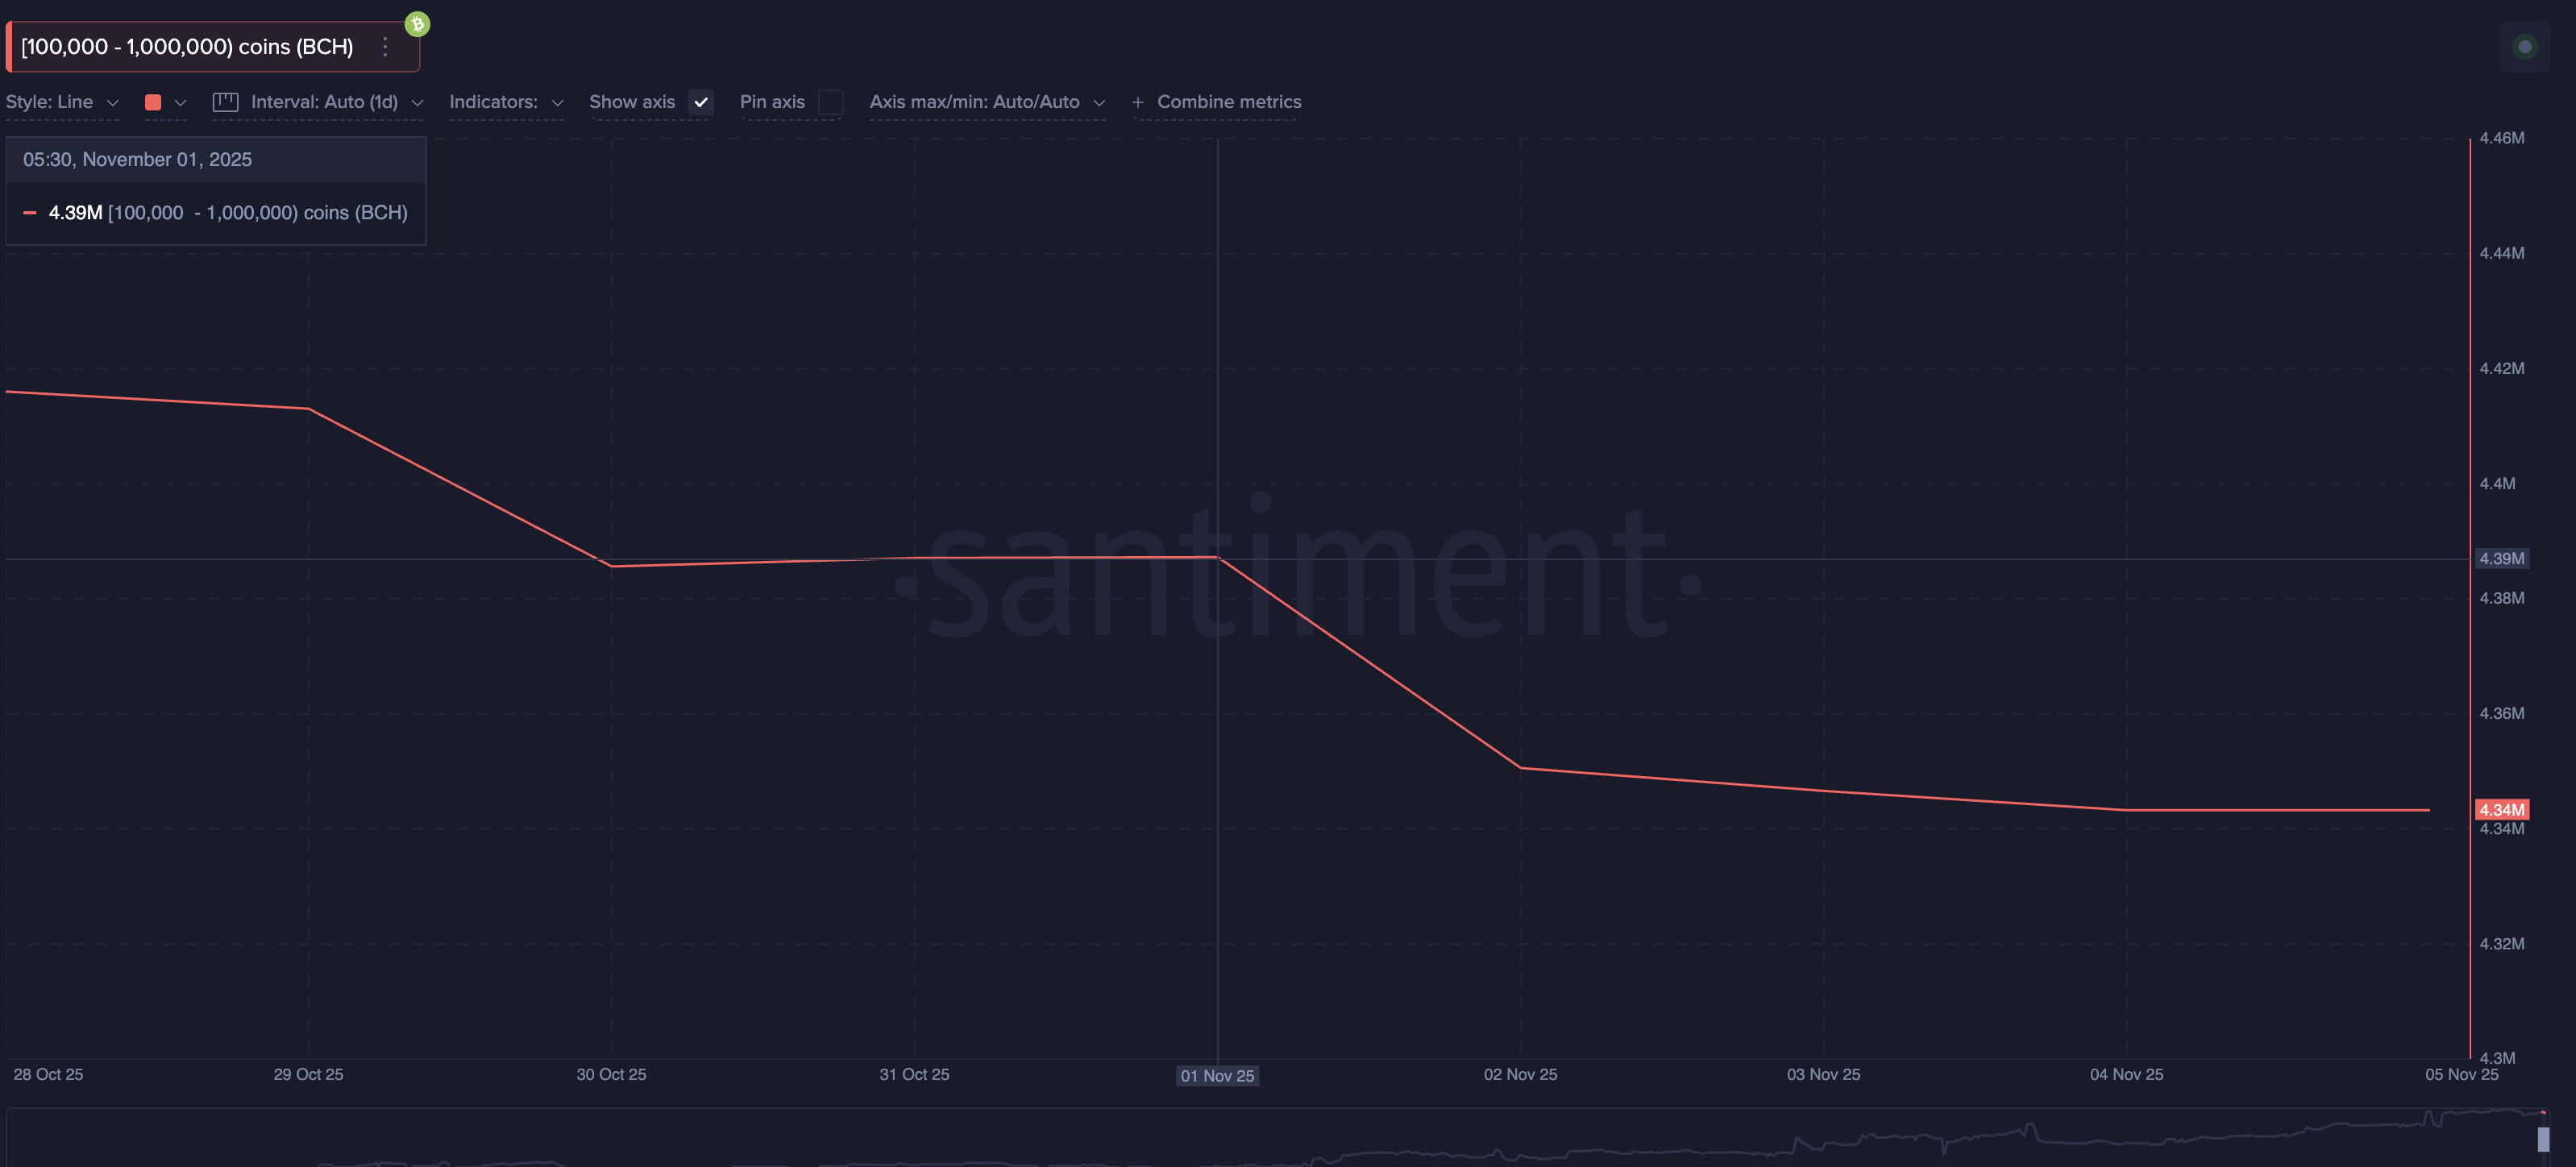 BCH Whales:
On the charts, BCH trades near $484. If Bitcoin weakens further, $439 is the next key support, below which a larger breakdown could begin. However, if BTC rebounds, BCH is likely to follow quickly.
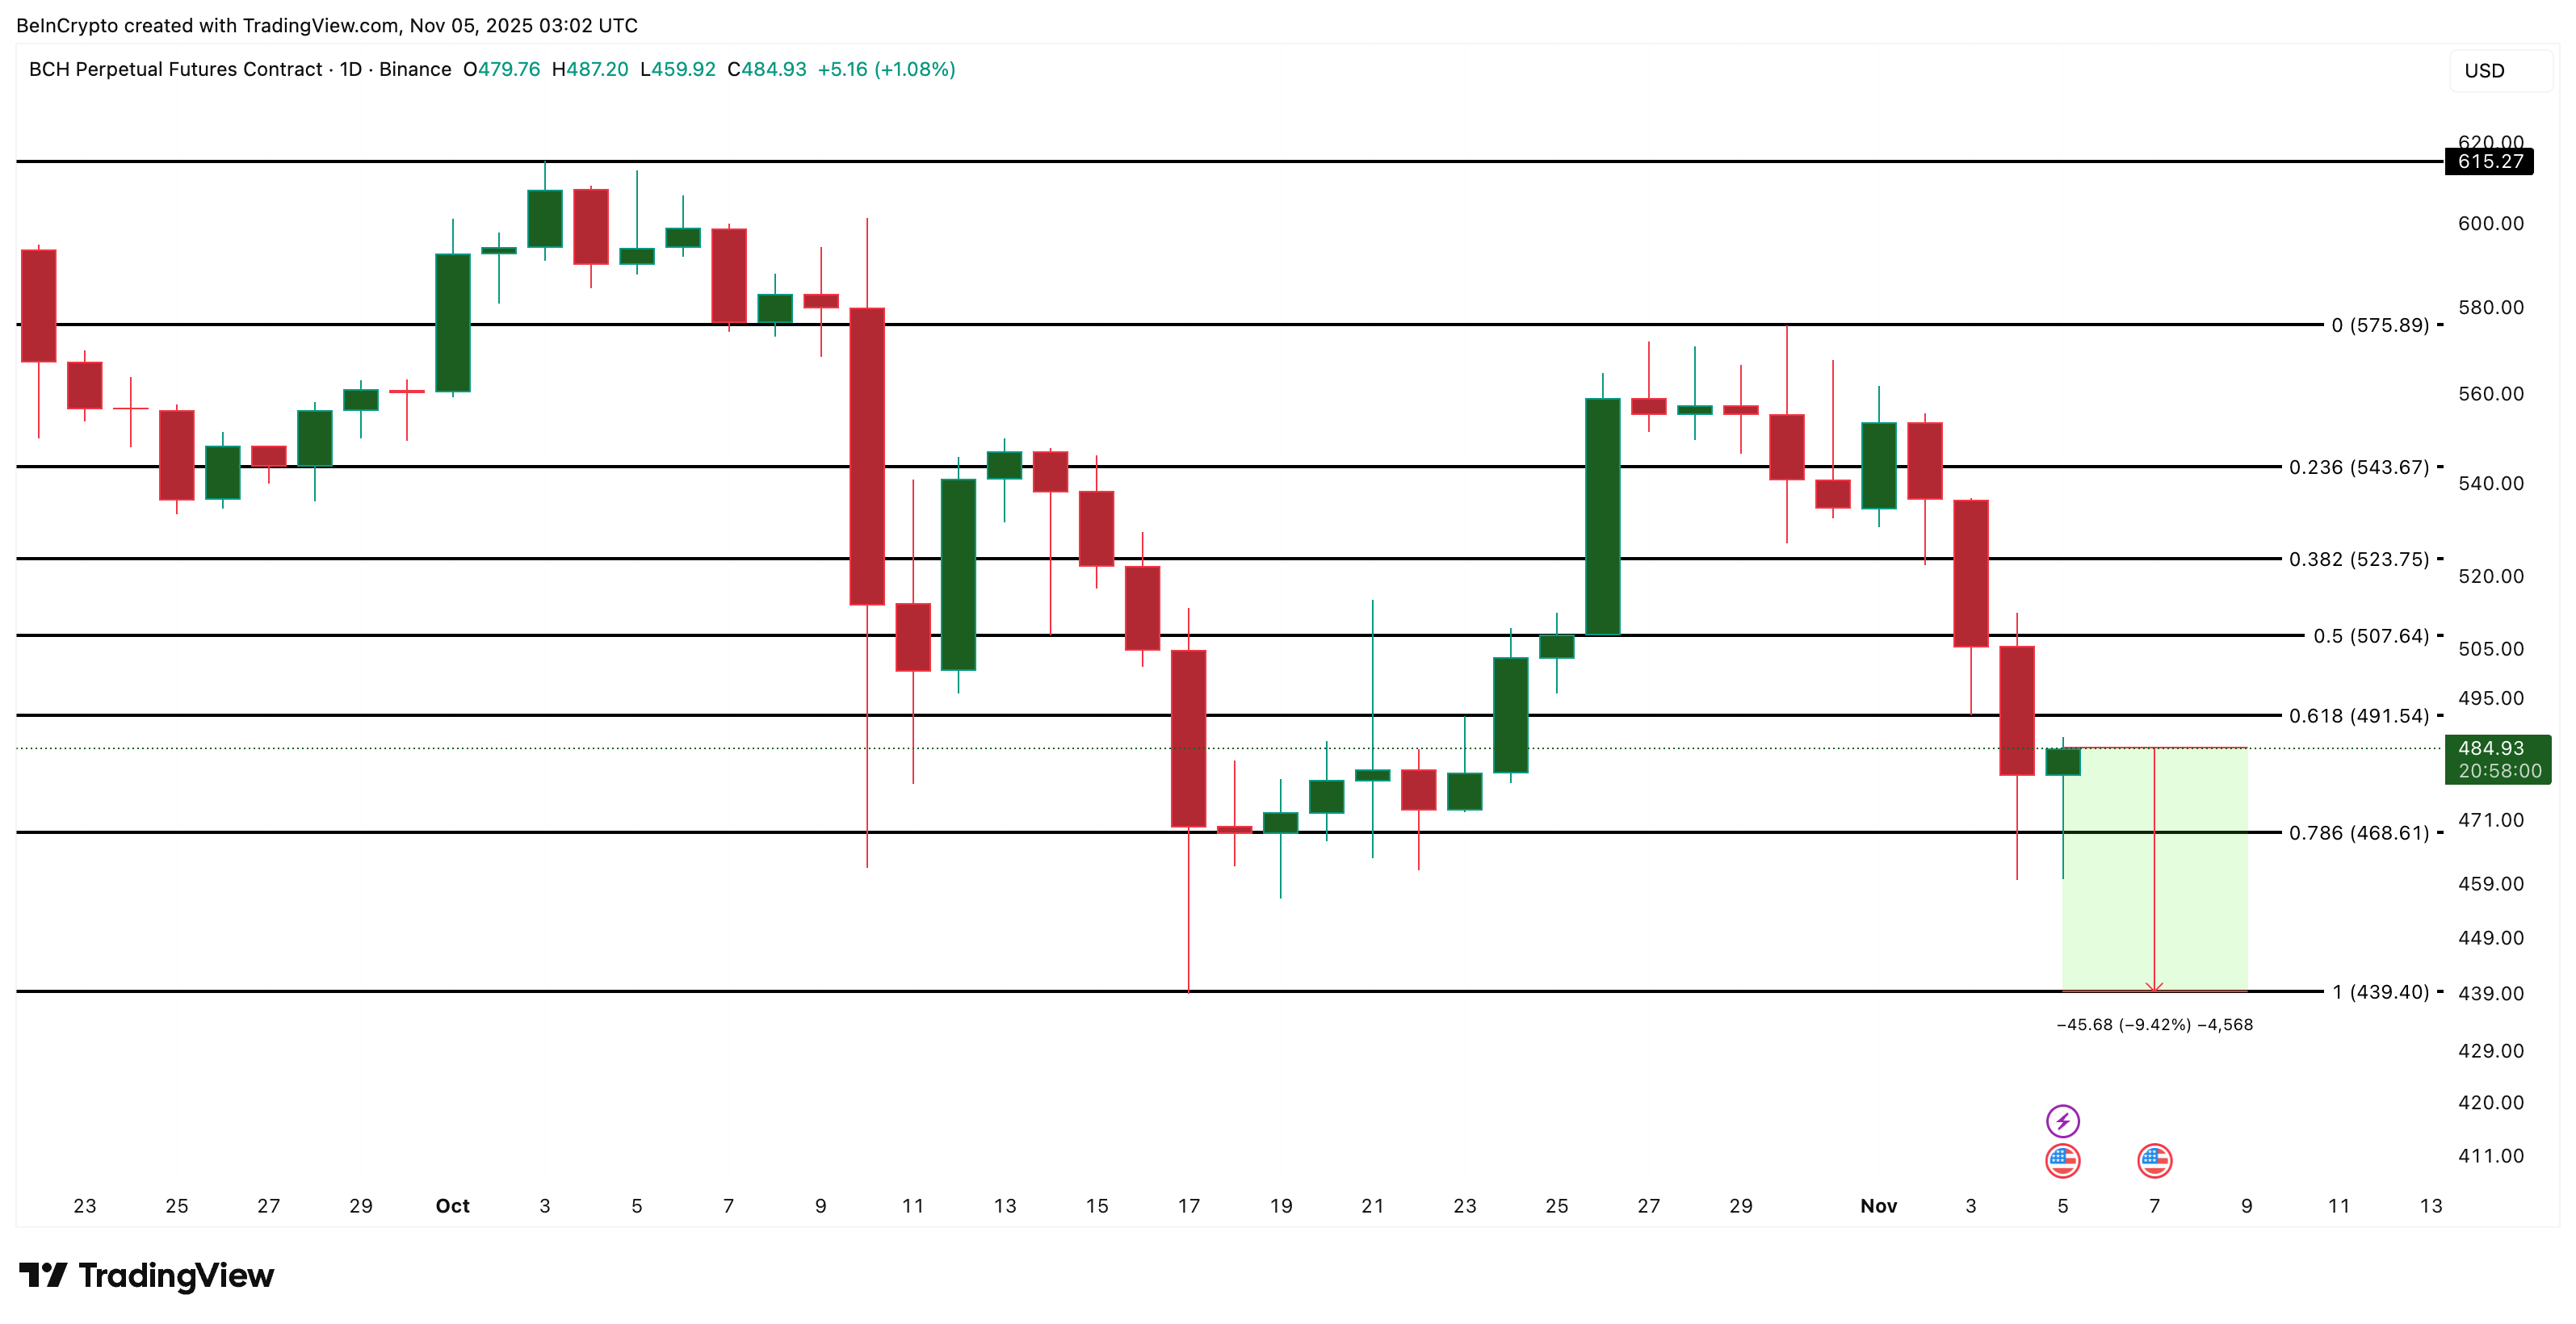 Bitcoin Cash Price Analysis:
A move above $491 would be the first recovery signal, while reclaiming $523 would invalidate the bearish setup, indicating that Bitcoin’s strength is also returning.
BNB (BNB)
BNB is another major altcoin to crash if Bitcoin falls, given its consistently strong correlation with BTC. The 7-day correlation between the two stands at 0.97, showing they move almost together.
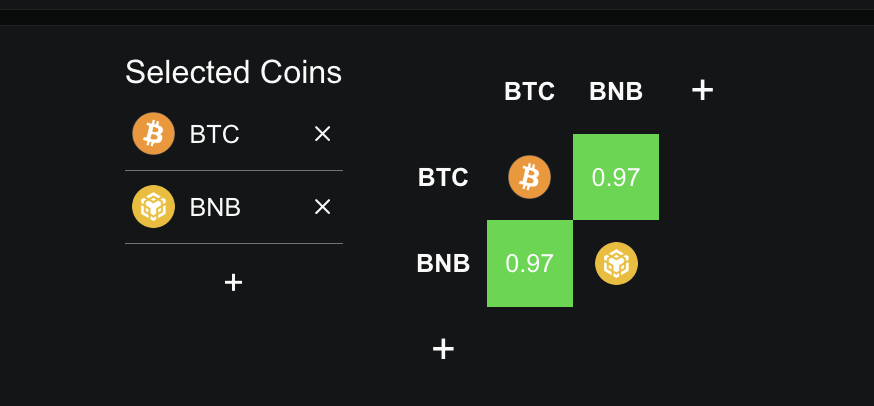 BNB-BTC 7-day Correlation:
Over the longer term, the one-year coefficient sits at 0.67, which still signals a strong positive link. That correlation is already visible in recent price data. BNB and Bitcoin have both corrected by over 4% in the past 24 hours.
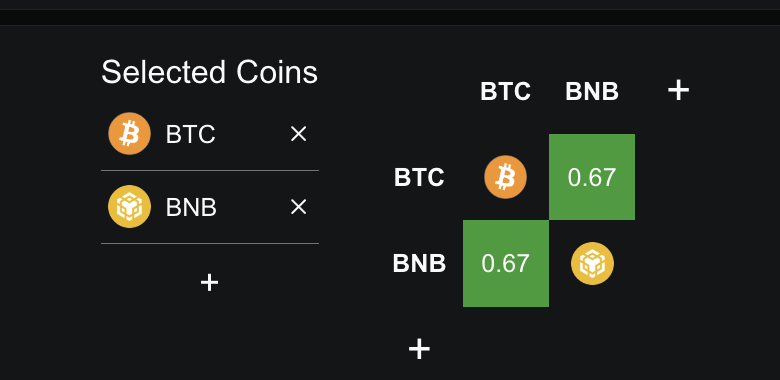 BNB-BTC Yearly Correlation:
The coin has followed BTC closely through this correction phase. However, despite the weakness, BNB remains one of the strongest performers of this cycle, still up 23.5% over the past three months.
On the Chaikin Money Flow (CMF) chart, large-wallet inflows have dropped sharply since October 22 but are now trending upward as Bitcoin rebounds above $101,600, suggesting early signs of renewed buying interest. The CMF tracks money inflows and outflows based on price and volume, mostly from large wallets.
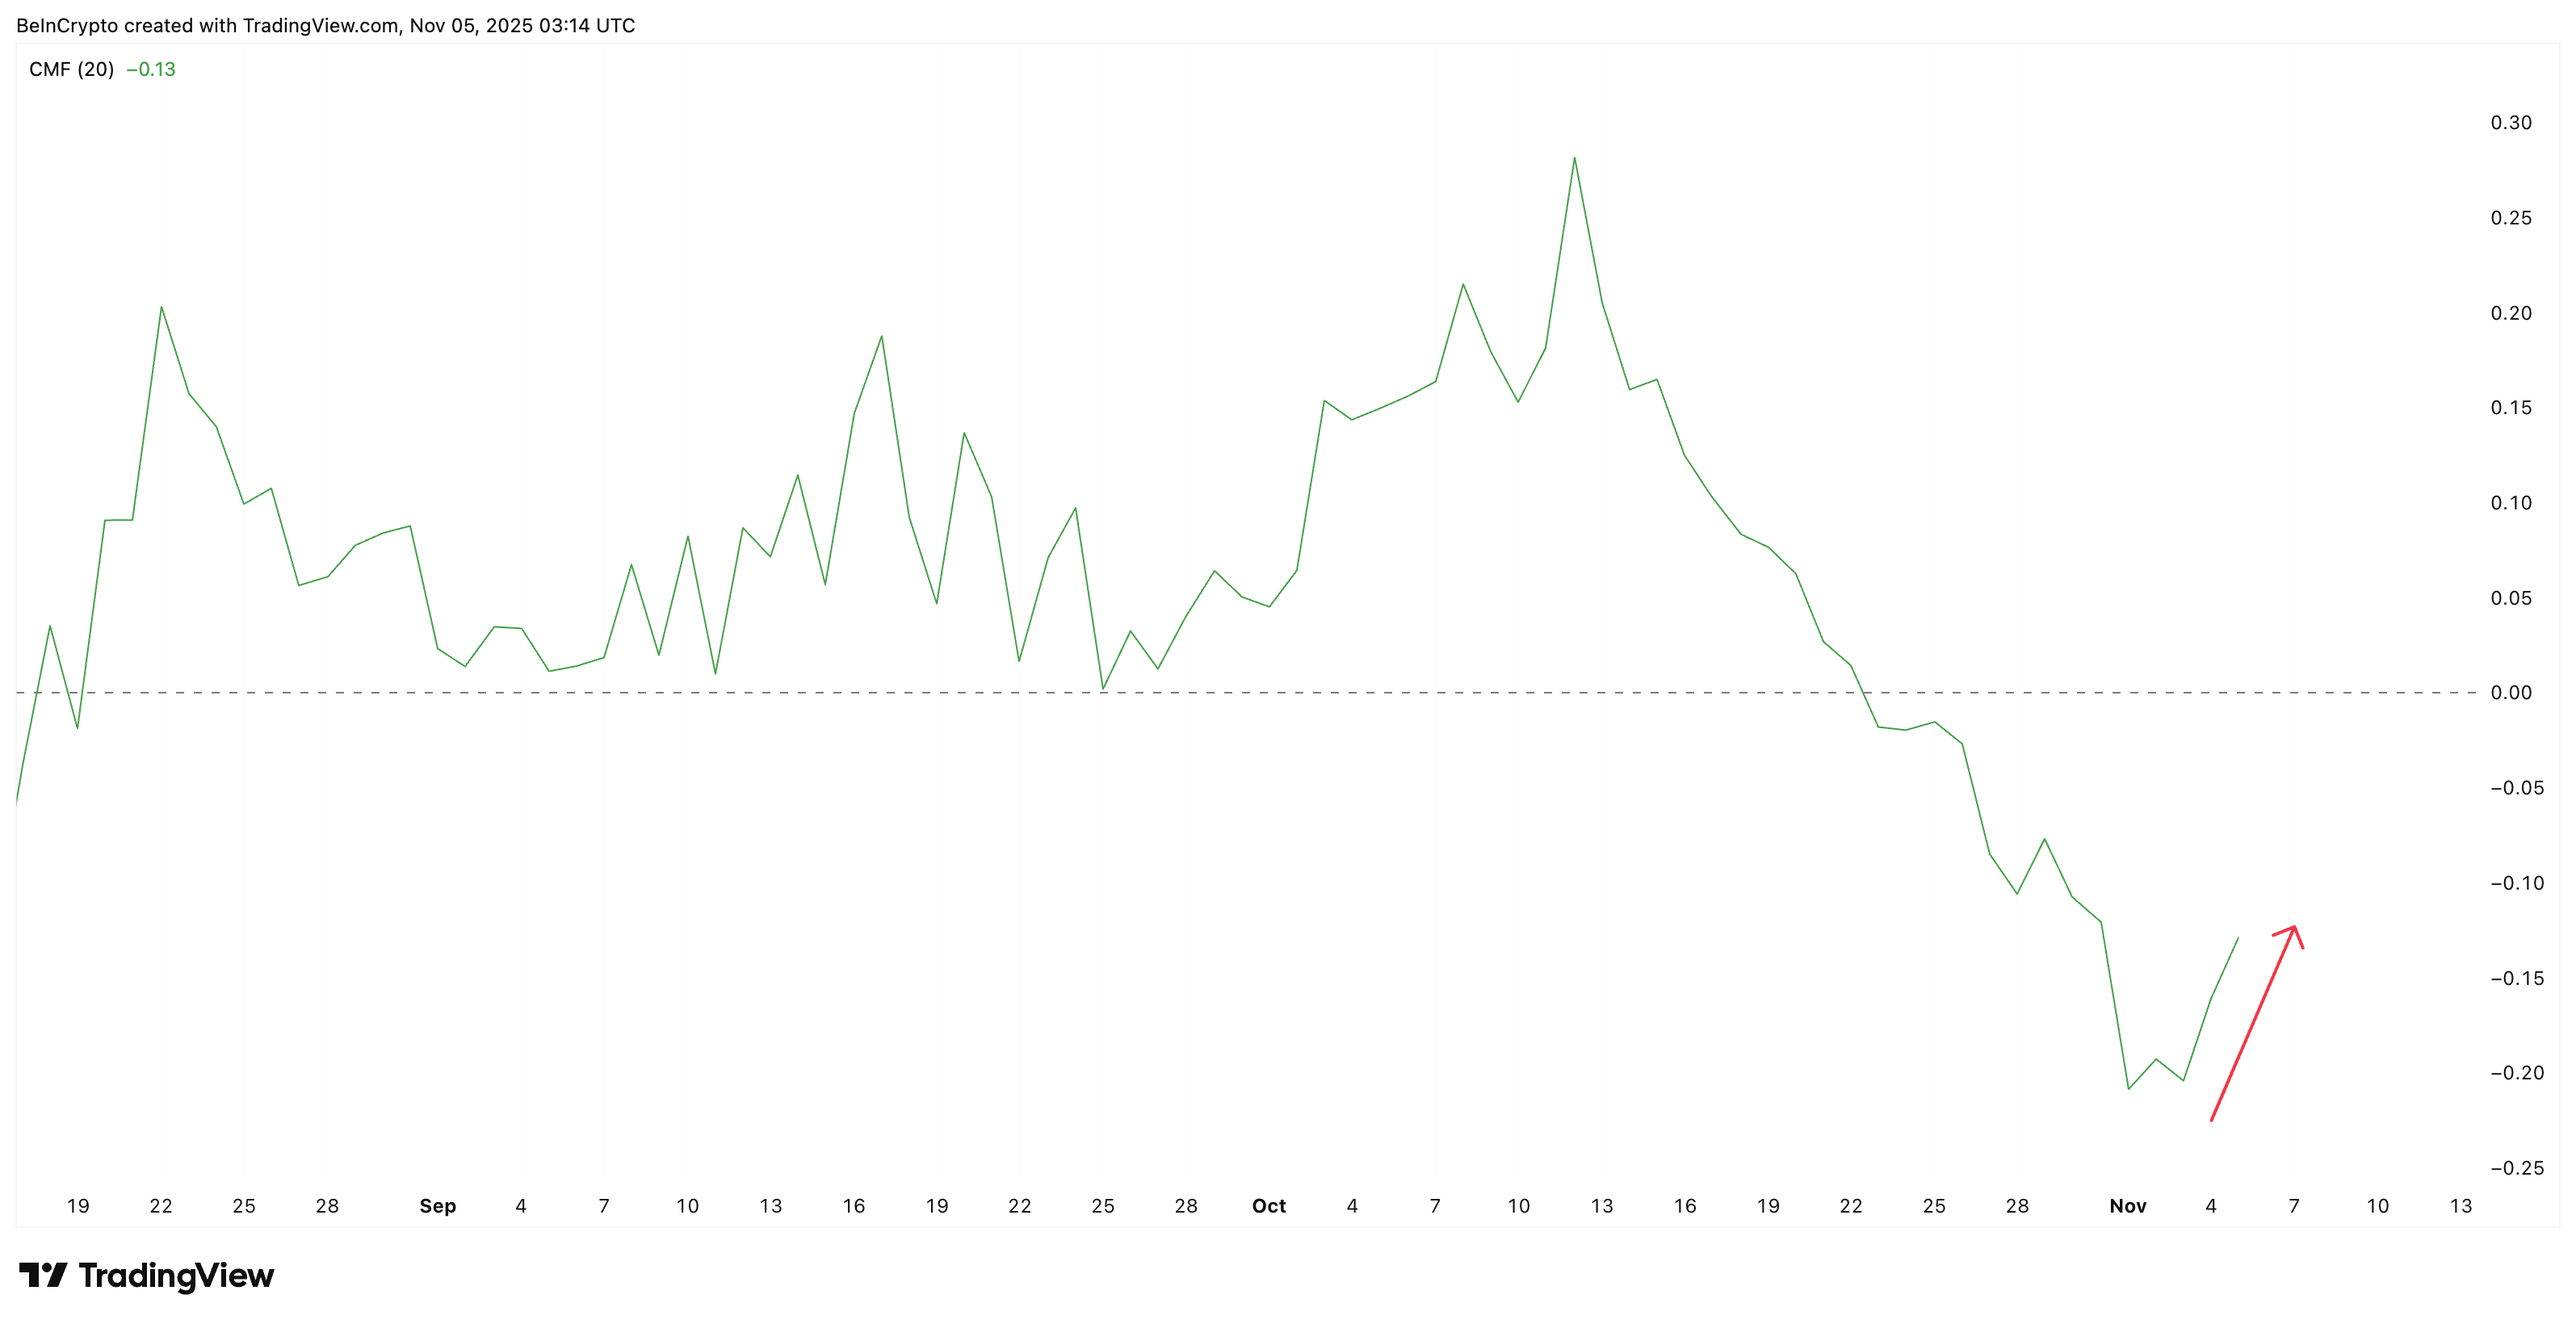 BNB Whales Start Adding After A Drop:
If Bitcoin manages to recover further, BNB could be one of the first coins to benefit. For that to happen, the price must hold above $946 to confirm a rebound setup.
Between October 10 and November 4, the price made a higher low while the Relative Strength Index (RSI) made a lower low — a hidden bullish divergence that hints at an ongoing uptrend beneath the correction. This pattern lends weight to the rebound setup, but only if BTC keeps strong.
The RSI measures price momentum to show if an asset is overbought or oversold.
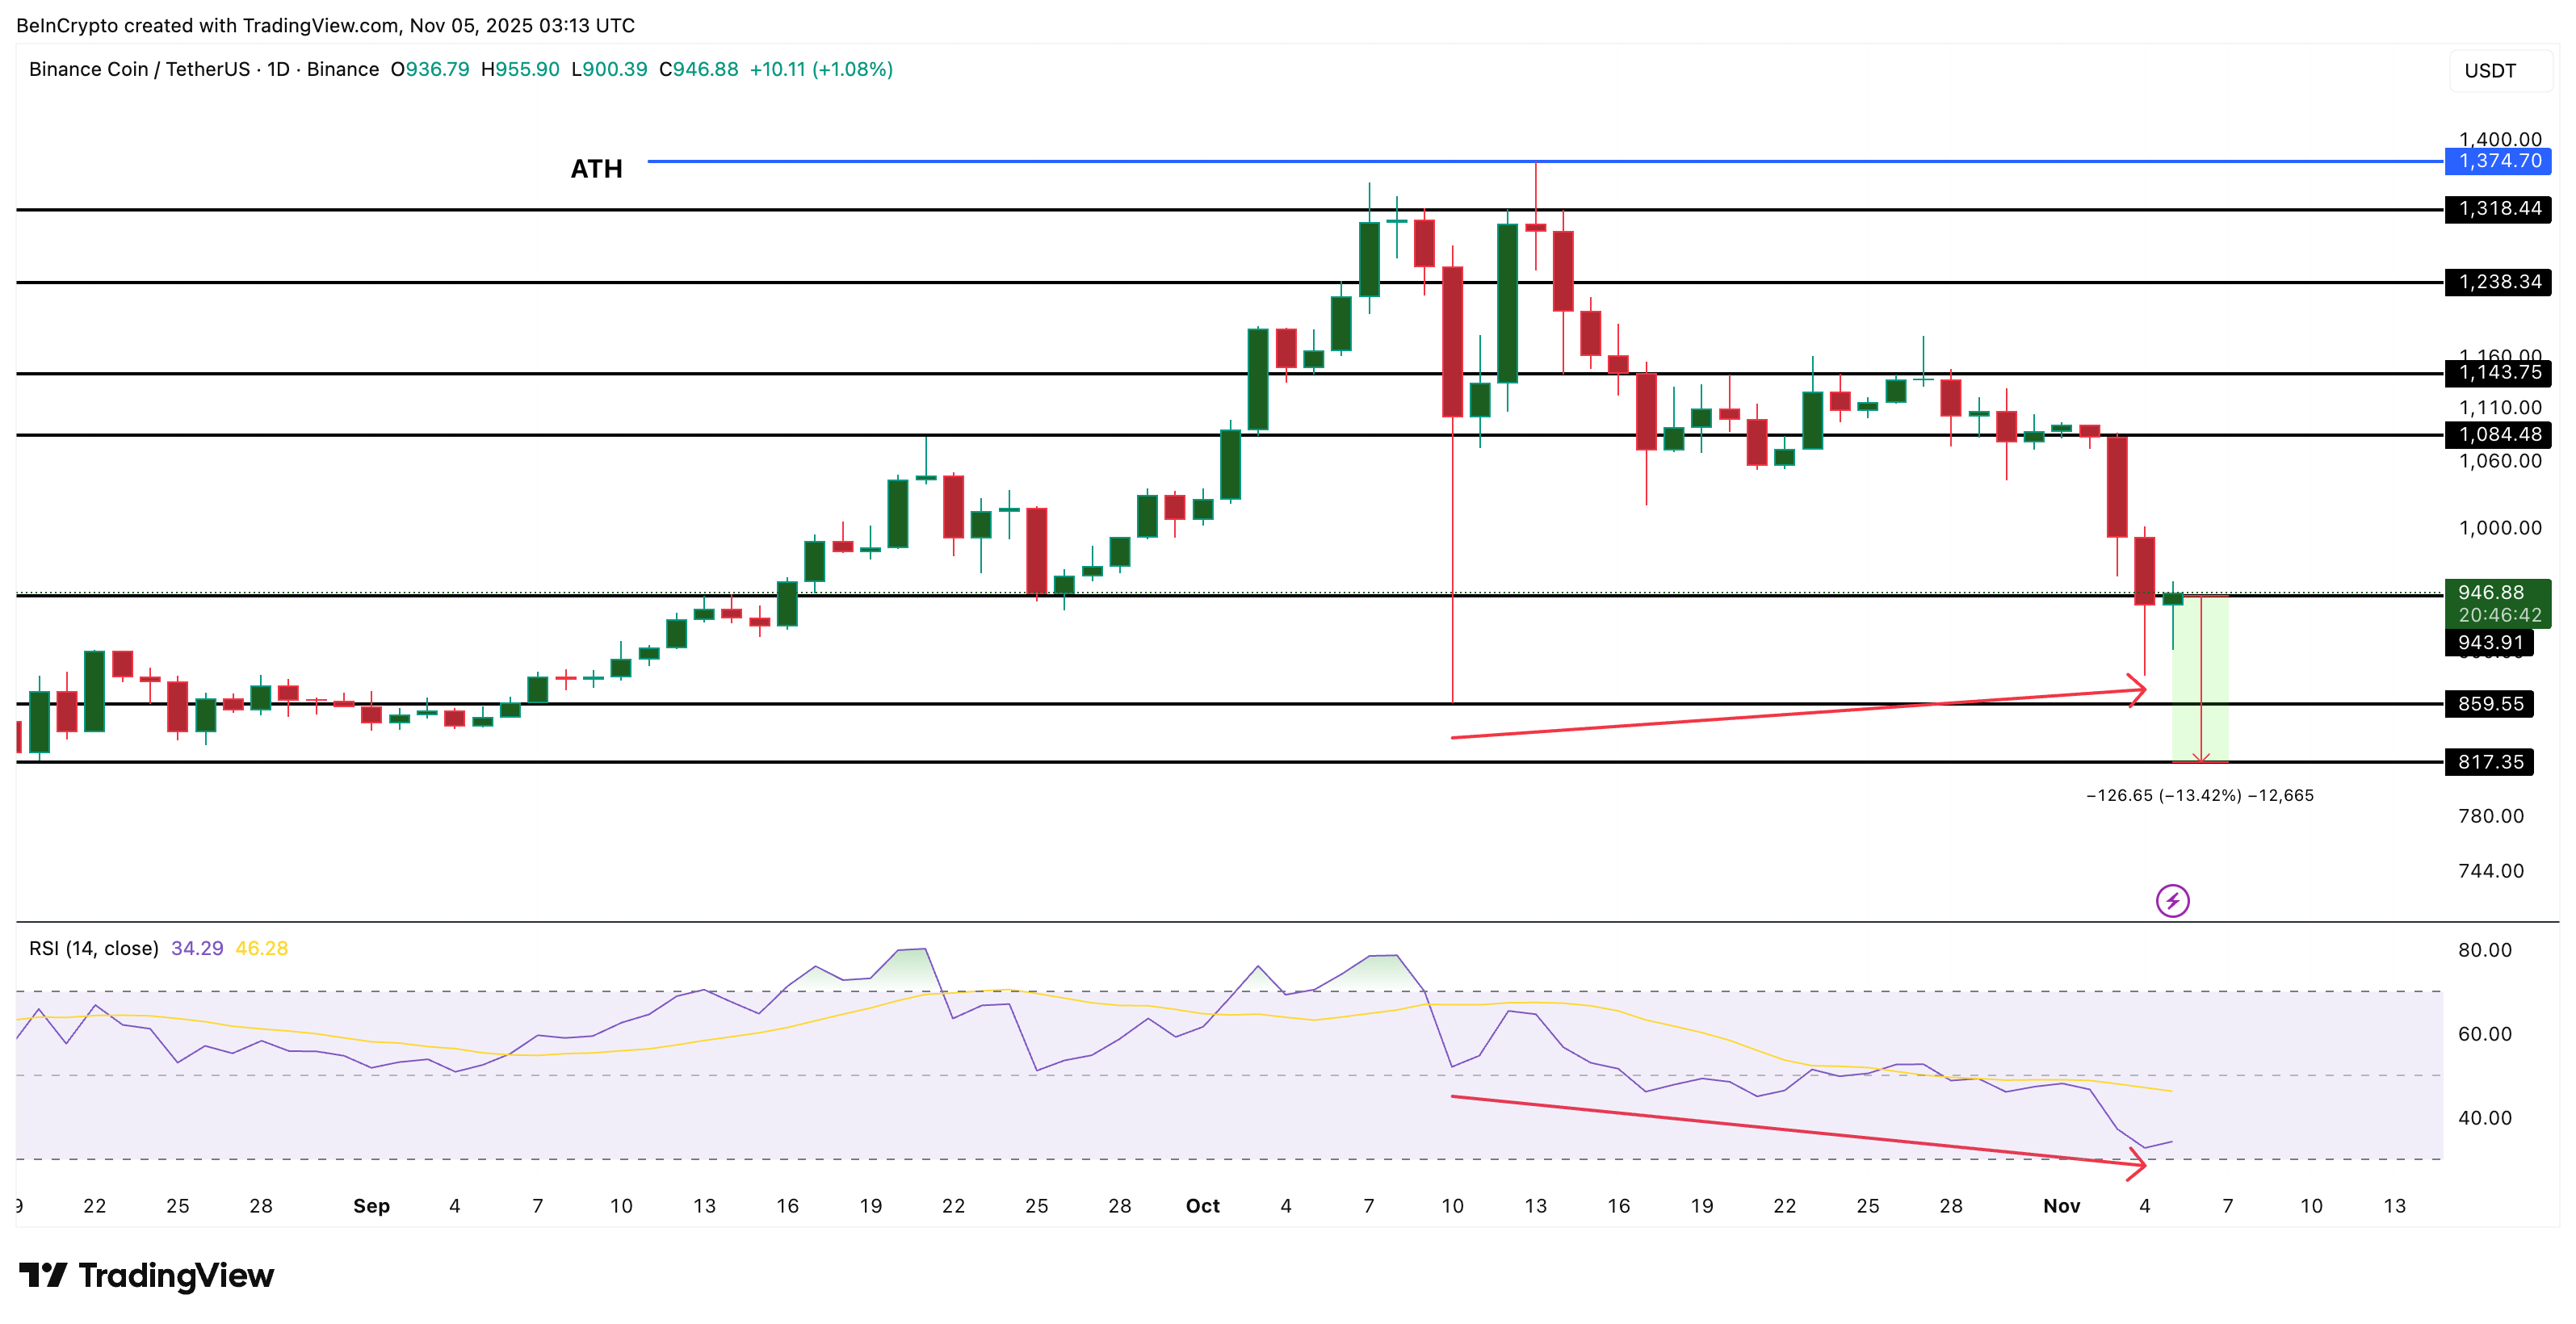 BNB Price Analysis:
A daily close above $1,084 would invalidate the bearish structure and point to recovery. However, if Bitcoin fails again and breaks below $100,000, the BNB price could test key supports at $859 and $817.
Litecoin (LTC)
Litecoin (LTC) is another altcoin to crash if Bitcoin falls, given its strong and consistent correlation with BTC across both short and medium time frames. The monthly Pearson correlation coefficient for Litecoin and Bitcoin stands at 0.92, showing they move almost perfectly in sync.
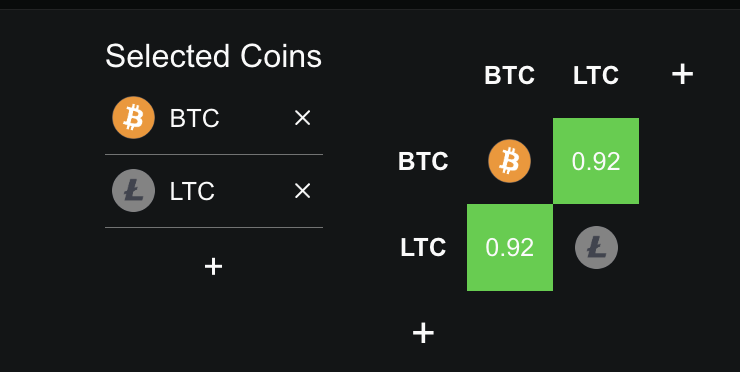 LTC-BTC Correlation:
That connection shows in recent performance. While Bitcoin has fallen over 18% this month, Litecoin has dropped even more — about 28%, reflecting its tighter sensitivity to BTC price swings. Even in the past 24 hours, LTC has slipped 3%, only slightly less than Bitcoin.
Large holders — addresses holding 100,000 to 1 million LTC — have also started reducing exposure since October 29. Their combined supply fell from 28.51 million to 28.19 million LTC, a drop of 0.32 million coins. At the current price, that equals roughly $28.8 million in tokens offloaded — a clear signal that bigger players are turning cautious.
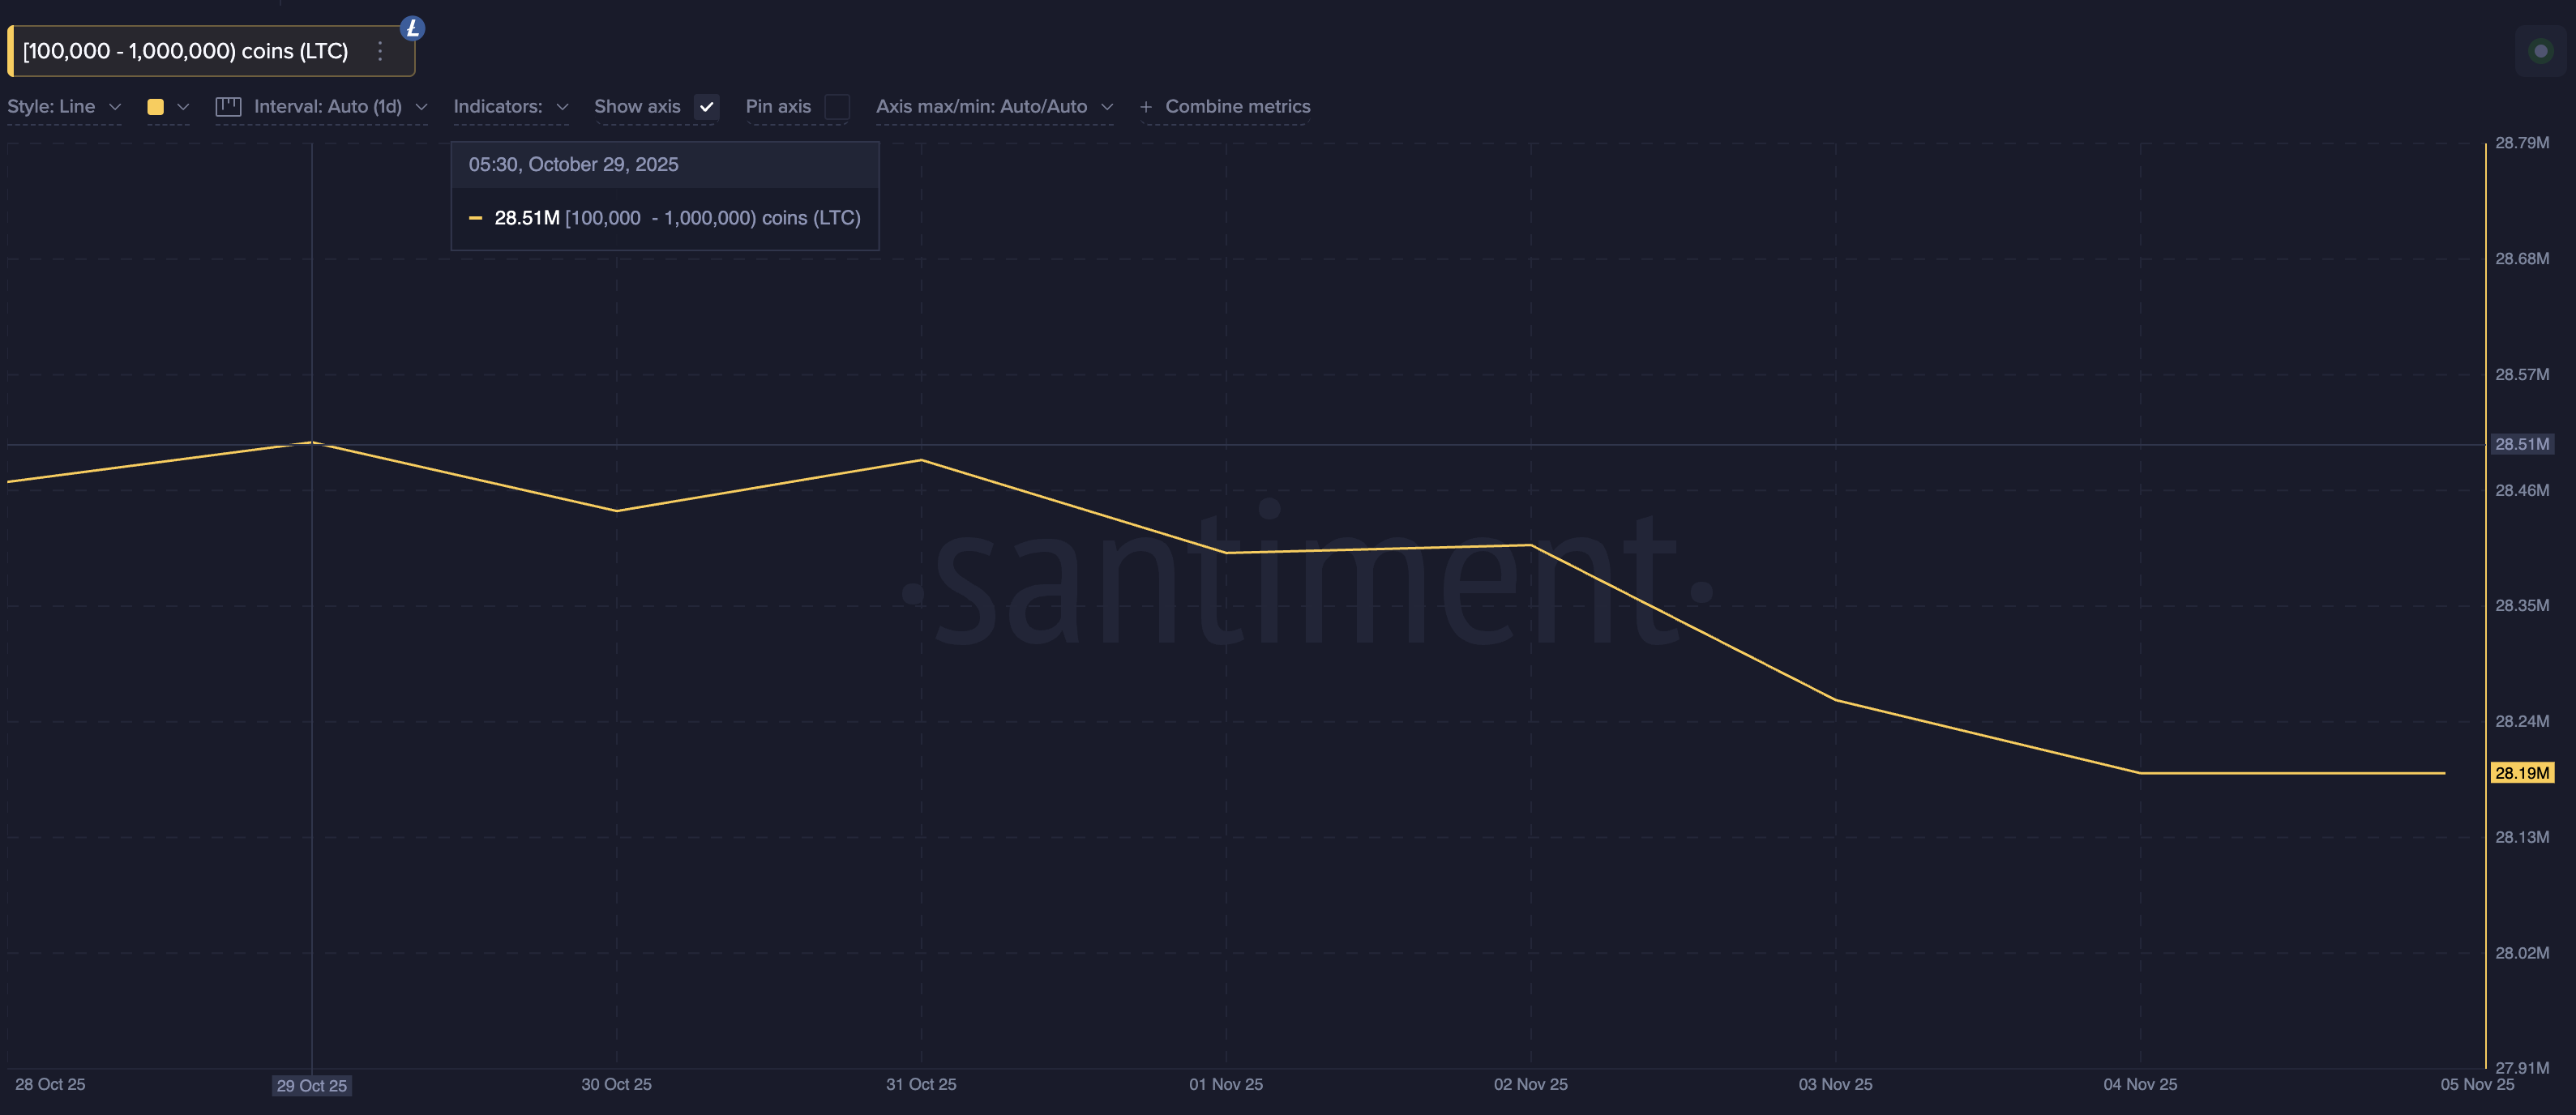 Big LTC Holders Dumping:
On the price chart, Litecoin trades near a strong support at $86. If that level breaks and Bitcoin weakens further, LTC could slide to $79, about 8.3% lower, and potentially even test $71 if bearish momentum builds.
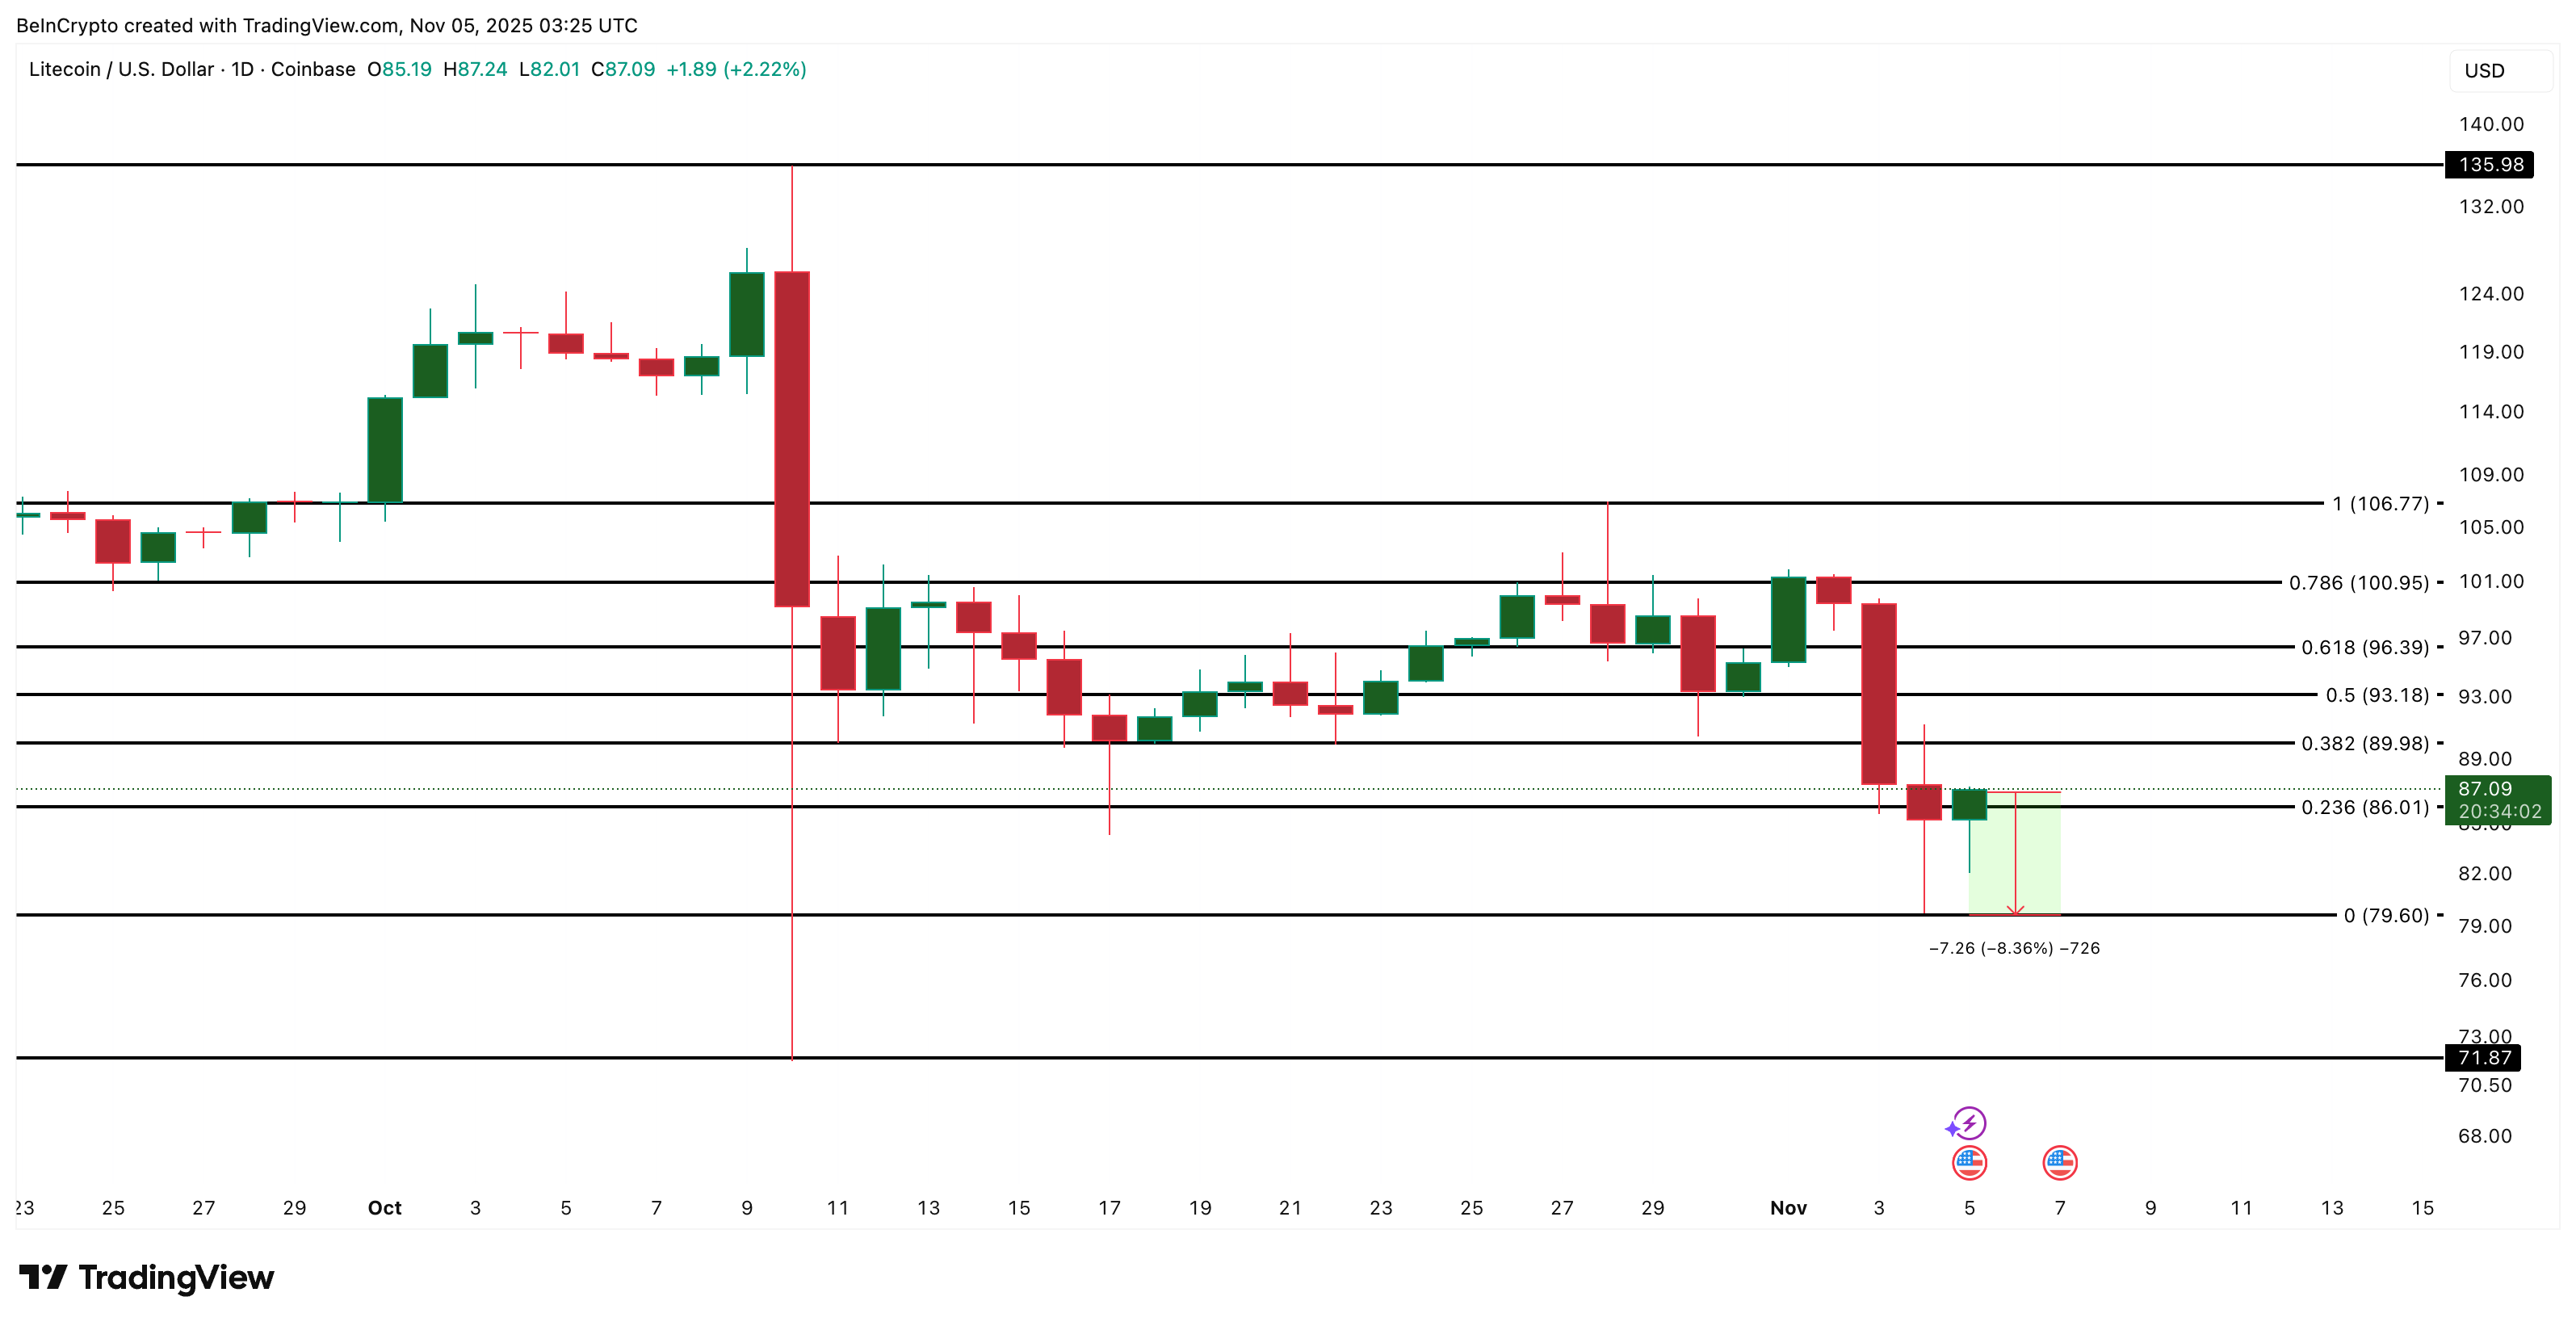 LTC Price Analysis:
However, if Bitcoin rebounds, Litecoin’s high correlation means it would likely bounce too. A move above $96 would invalidate the current bearish setup, while reclaiming $100 would confirm strength returning to both assets.
Disclaimer: The content of this article solely reflects the author's opinion and does not represent the platform in any capacity. This article is not intended to serve as a reference for making investment decisions.
You may also like
How Ethereum Could Stay Secure Even If Today’s Online Locks Stop Working

Cardano Price Prediction: Can ADA Defend $0.22 as Hoskinson Builds a New Programming Language?
 VIPAI Asset Sell-Off and Selective Rotation in Crypto
1. Technology stocks fell sharply as investor interest shifted toward energy and selected defensive assets. From October 10 to 16, the Nasdaq 100 declined 5.49% and the S&P 500 fell 1.95%, while the Dow gained 0.67% and WTI crude rose 10.41%. BTC, ETH, and SOL declined 1.27%, 2.65%, and 4.44%, respectively. This week's technology earnings will be an important test of whether revenue growth, margins, and cash flow can justify current valuations. Better-than-expected results could help stabilize markets in the near term. 2. Crypto continues to see pockets of strong activity, but a broad-based altcoin season has yet to materialize. CoinMarketCap's (CMC) Altcoin Season Index stood at 54 as of the October 18 UTC daily observation, below the altcoin-season threshold of 75, while BTC dominance rose to 60.08%. Our proxy leverage ratio fluctuated between 4.00 and 4.07 during the week, showing no sustained increase and suggesting limited appetite for additional leverage. Meanwhile, as major exchanges expand access to traditional financial assets, the recent sell-off in AI-related equities could attract short-term speculative capital away from crypto. Such capital rotation could make it more difficult for a new altcoin season to take hold. 3. Papertrade's loss-to-mine model has generated significant interest across the crypto community. The protocol combines high-leverage derivatives trading with zero slippage and a mechanism that rewards trading losses with PAPER tokens. Across the eight complete UTC days from October 10 to 17, cumulative reported revenue reached approximately $56.08 million, including $51.90 million distributed to token holders. With growing participation from key opinion leaders (KOLs), Papertrade has reportedly ranked among the top three platforms by profitability in the broader market recently. Assets to watch: BTC, ETH, SOL, ARB, OP, SKHYNIX, SKHY, META, TSLA, LRCX, and SPCX. Key research priorities this week: Cash flow performance in technology earnings; the relative discount and holding costs of the two SK Hynix contracts; and U.S. initial jobless claims and PMI data. Weekly market data cover the period through October 16, while research information was verified through October 18. Observation periods are specified separately for each chart.

Why Bernstein Thinks the AI Stock Sell-Off Could Help Small Caps

Crypto prices
More


