
Bitcoin Bull Score Hits Level Seen Only 7 Times In 6 Years – A Rare Historical Signal

By:Newsbtc
Bitget offers one-stop trading for cryptocurrencies, stocks, and gold. Trade now!
A welcome pack worth 6200 USDT for new users! Sign up now!
Bitcoin has shown renewed bullish momentum in recent sessions, pushing price back toward the $97,000 level after weeks of persistent selling pressure. For much of the recent consolidation, the market struggled under distribution from short-term participants and cautious positioning from traders who remained uncertain about the broader trend.
That dynamic now appears to be shifting. While price action alone does not confirm a full trend reversal, the latest rebound suggests that downside pressure is easing and that buyers are becoming more willing to absorb available supply.
This improvement in price behavior is supported by on-chain context rather than pure speculation. A quick insight from a CryptoQuant analyst highlights a rare development in market sentiment: the Bitcoin Bull Score Index has dropped to 20, a level that has historically appeared only a handful of times over the past several years. Such readings typically reflect deeply pessimistic conditions, when bullish signals across multiple indicators are scarce.
var rnd = window.rnd || Math.floor(Math.random()*10e6); var pid607465 = window.pid607465 || rnd; var plc607465 = window.plc607465 || 0; var abkw = window.abkw || ''; var absrc = 'https://servedbyadbutler.com/adserve/;ID=172179;size=0x0;setID=607465;type=js;sw='+screen.width+';sh='+screen.height+';spr='+window.devicePixelRatio+';kw='+abkw+';pid='+pid607465+';place='+(plc607465++)+';rnd='+rnd+';click=CLICK_MACRO_PLACEHOLDER'; document.write('
');
if (!window.AdButler){(function(){var s = document.createElement("script"); s.async = true; s.type = "text/javascript";s.src = "https://servedbyadbutler.com/app.js";var n = document.getElementsByTagName("script")[0]; n.parentNode.insertBefore(s, n);}());}
var AdButler = AdButler || {}; AdButler.ads = AdButler.ads || []; var abkw = window.abkw || ""; var plc366606 = window.plc366606 || 0; (function(){ var divs = document.querySelectorAll(".plc366606:not([id])"); var div = divs[divs.length-1]; div.id = "placement_366606_"+plc366606; AdButler.ads.push({handler: function(opt){ AdButler.register(172179, 366606, [728,90], "placement_366606_"+opt.place, opt); }, opt: { place: plc366606++, keywords: abkw, domain: "servedbyadbutler.com", click:"CLICK_MACRO_PLACEHOLDER" }}); })();
Paradoxically, these environments often coincide with transitional phases rather than sustained declines. When bearish sentiment becomes widespread and measurable optimism disappears, markets tend to become increasingly sensitive to even modest improvements in demand.
Over the past six years, the Bitcoin Bull Score Index has fallen to levels of 20 or lower only seven times. The market is now experiencing the seventh occurrence, placing the current environment among the rarest sentiment regimes in Bitcoin’s history.
This index aggregates multiple on-chain and market indicators to assess whether conditions favor bullish continuation or reflect broad-based weakness. Readings near 20 indicate that very few bullish signals are active at the same time, highlighting a market dominated by caution rather than optimism.
var rnd = window.rnd || Math.floor(Math.random()*10e6); var pid607472 = window.pid607472 || rnd; var plc607472 = window.plc607472 || 0; var abkw = window.abkw || ''; var absrc = 'https://servedbyadbutler.com/adserve/;ID=172179;size=0x0;setID=607472;type=js;sw='+screen.width+';sh='+screen.height+';spr='+window.devicePixelRatio+';kw='+abkw+';pid='+pid607472+';place='+(plc607472++)+';rnd='+rnd+';click=CLICK_MACRO_PLACEHOLDER'; document.write('
');
if (!window.AdButler){(function(){var s = document.createElement("script"); s.async = true; s.type = "text/javascript";s.src = "https://servedbyadbutler.com/app.js";var n = document.getElementsByTagName("script")[0]; n.parentNode.insertBefore(s, n);}());}
var AdButler = AdButler || {}; AdButler.ads = AdButler.ads || []; var abkw = window.abkw || ""; var plc452518 = window.plc452518 || 0; (function(){ var divs = document.querySelectorAll(".plc452518:not([id])"); var div = divs[divs.length-1]; div.id = "placement_452518_"+plc452518; AdButler.ads.push({handler: function(opt){ AdButler.register(172179, 452518, [728,90], "placement_452518_"+opt.place, opt); }, opt: { place: plc452518++, keywords: abkw, domain: "servedbyadbutler.com", click:"CLICK_MACRO_PLACEHOLDER" }}); })();
 Bitcoin Bull Score Index | Source:
CryptoQuant
Bitcoin Bull Score Index | Source:
CryptoQuant
Historically, such extremes have tended to appear during transitional phases. They often emerge late in corrections, when selling pressure has largely played out, but confidence has not yet returned. This does not guarantee an immediate reversal. However, it does suggest that downside momentum is becoming increasingly fragile, as most participants who wanted to de-risk have already done so.
The timing of this signal is particularly relevant as Bitcoin approaches a critical psychological zone near $100,000. This level represents both a major round-number resistance and a key reference point for short-term and long-term holders.
The coming weeks will be decisive. A sustained push toward and above $100K, accompanied by improving breadth in on-chain indicators, would likely mark a shift away from defensive positioning. Conversely, failure at this level could reinforce consolidation and prolong uncertainty.
var rnd = window.rnd || Math.floor(Math.random()*10e6); var pid607473 = window.pid607473 || rnd; var plc607473 = window.plc607473 || 0; var abkw = window.abkw || ''; var absrc = 'https://servedbyadbutler.com/adserve/;ID=172179;size=0x0;setID=607473;type=js;sw='+screen.width+';sh='+screen.height+';spr='+window.devicePixelRatio+';kw='+abkw+';pid='+pid607473+';place='+(plc607473++)+';rnd='+rnd+';click=CLICK_MACRO_PLACEHOLDER'; document.write('
');
if (!window.AdButler){(function(){var s = document.createElement("script"); s.async = true; s.type = "text/javascript";s.src = 'https://servedbyadbutler.com/app.js';var n = document.getElementsByTagName("script")[0]; n.parentNode.insertBefore(s, n);}());}
var AdButler = AdButler || {}; AdButler.ads = AdButler.ads || []; var abkw = window.abkw || ''; var plc452519 = window.plc452519 || 0; (function(){ var divs = document.querySelectorAll(".plc452519:not([id])"); var div = divs[divs.length-1]; div.id = "placement_452519_"+plc452519; AdButler.ads.push({handler: function(opt){ AdButler.register(172179, 452519, [728,90], 'placement_452519_'+opt.place, opt); }, opt: { place: plc452519++, keywords: abkw, domain: 'servedbyadbutler.com', click:'CLICK_MACRO_PLACEHOLDER' }}); })();
OG Bitcoin Selling Slows Sharply: Long-Dormant Coins Go Quiet
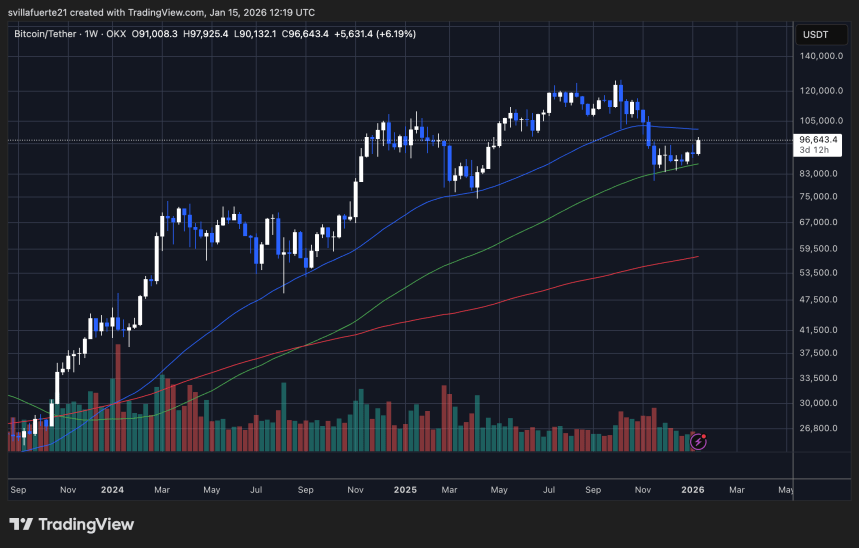
Bitcoin’s weekly chart shows a market attempting to reassert strength after a prolonged corrective phase, with price now trading around the $96,000–$97,000 zone. This area is technically important, as it aligns with a former consolidation range that acted as support during mid-2025 and later flipped into resistance after the November breakdown. The recent rebound suggests buyers are willing to defend higher lows, but confirmation remains incomplete.
 Bitcoin testing key resistance level below $100K | Source:
BTCUSDT chart on TradingView
Bitcoin testing key resistance level below $100K | Source:
BTCUSDT chart on TradingView
From a trend perspective, Bitcoin is still trading below the declining 50-week moving average, which currently caps upside attempts. This level has acted as dynamic resistance during previous bear-to-neutral transitions. And will be a critical area to reclaim for trend continuation.
Below the price, the 100-week moving average continues to slope upward and has provided structural support during the recent pullbacks. Reinforcing the idea that the broader market structure remains intact despite short-term weakness.
Bitcoin Short-Term Holders Near A Profit Flip: A Key Level Comes Into Focus
Volume behavior is also notable. The rebound toward $97,000 occurred without a major expansion in volume, revealing that the move may still lack strong conviction. This supports the view that the current advance could be a recovery leg within a larger consolidation rather than the start of an impulse.
If Bitcoin can consolidate above $95,000 and eventually reclaim the 50-week moving average, the probability of a continuation toward the $105,000–$110,000 region increases. Failure to hold this zone would expose the market to renewed downside tests toward the mid-$80,000s. Keeping the broader consolidation unresolved.
Featured image from ChatGPT, chart from TradingView.com
0
0
Disclaimer: The content of this article solely reflects the author's opinion and does not represent the platform in any capacity. This article is not intended to serve as a reference for making investment decisions.
Understand the market, then trade.
Bitget offers one-stop trading for cryptocurrencies, stocks, and gold.
Trade now!
You may also like
 VIPMiddle East Tensions Raise Rate Risks but May Create Buying Opportunities
1. The sharp escalation in Middle East tensions pushed Brent crude to multi-year highs of $105–$107 per barrel, reviving inflation expectations. The 10-year U.S. Treasury yield surged to 4.94%, its highest level since 2023, while the implied probability of a rate hike at the September 16 policy meeting to the 3.75%–4.00% range rose from 48.4% one month ago to 67.1%. 2. Rising oil prices and rate-hike expectations weighed on most risk assets, but historical data suggest that this is more likely to be a short-term adjustment than a reversal of the broader trend. Bitcoin fell 3.36% this week and the S&P 500 declined 1.64%, while gold slipped just 0.96%. Outside the energy sector, markets are largely repricing ahead of next week's expected rate decision. 3. PoolX has recently introduced a long-term holding bonus, significantly improving effective returns for users who maintain assets on the platform over time. The core participation rules remain unchanged; the update adds an additional boost to the effective locked amount for users with qualifying long-term holdings. In the example provided, a user locking 1000 ETH would see the estimated reward increase from 1666.67 USDT to 2500 USDT, or about 50%, while the reference APR rises from 4.93% to 7.40%. Assets to watch: BTC, ETH, SOL, Brent crude, WTI crude, gold, 10-year U.S. Treasuries, RAY, ZEC, LEN, CCL.
Bitget•2026/09/14 08:10

NASDAQ TRADE HALT CONTINUES <EFTY.O> REASON NOT AVAILABLE AT 03:58 AM
Reuters•2026/09/14 07:58
NASDAQ TRADE HALT CONTINUES <NRSN.O> REASON NOT AVAILABLE AT 03:58 AM
Reuters•2026/09/14 07:58
NASDAQ TRADE HALT <NFEGP.O> REASON NOT AVAILABLE AT 03:58 AM
Reuters•2026/09/14 07:58
Crypto prices
More
Bitcoin
BTC
$77,761.75
+0.86%

Ethereum
ETH
$2,519.46
+0.10%

Tether USDt
USDT
$0.9995
-0.01%

BNB
BNB
$724.73
+0.33%

XRP
XRP
$1.39
+2.05%

USDC
USDC
$0.9999
+0.01%

Solana
SOL
$101.5
+0.75%

TRON
TRX
$0.3391
-0.25%

Hyperliquid
HYPE
$79.75
+1.55%

Zcash
ZEC
$1,137.16
+0.54%
How to buy BTC
Bitget lists BTC – Buy or sell BTC quickly on Bitget!
Trade now
Become a trader now?A welcome pack worth 6200 USDT for new users!
Sign up now