coinedition.com
XRP price today trades near $1.8896 as the descending triangle pattern continues to compress. The technical setup approaches resolution while the XRP Ledger hits a significant adoption milestone that could provide fundamental support for the next directional move.
XRPL Reaches $1 Billion Tokenized Assets
$XRP Ledger just smashed a massive milestone: $1 BILLION in on-chain tokenized assets! 🚀
— PaulBarron (@paulbarron) January 26, 2026
Flip from "crypto casino" to the world's financial infrastructure. 🌍🏦
The drivers?
✅ $RLUSD leading the chargenow live on @binance ✅ Tokenized U.S. Treasuries & Funds 🇺🇸
✅… pic.twitter.com/P27RfHQYnF
The XRP Ledger has crossed $1 billion in on-chain tokenized assets, marking a significant milestone for institutional adoption. The achievement was driven by several factors including the RLUSD stablecoin launch on Binance, tokenized U.S. Treasuries and funds, and the network’s quantum-resistant security features.
The milestone represents a shift in how the market views XRP infrastructure. Rather than pure speculation, the network is becoming rails for tokenized real-world assets where institutions value speed, low fees, and scalability.
RLUSD has been particularly impactful since launching on major exchanges. The stablecoin brings institutional-grade liquidity to XRPL while demonstrating practical utility beyond token trading.
Whether this fundamental development translates to price appreciation depends on whether the technical pattern breaks higher or lower. Strong fundamentals can support price during breakouts but rarely prevent breakdowns when technical levels fail.
Open Interest Rises As Triangle Tightens
Derivatives data shows traders positioning for volatility. Open interest climbed 3.07% to $3.40 billion while trading volume dropped 16.87% to $4.93 billion. Rising OI with declining volume suggests traders are building positions rather than actively trading.
Over the past 24 hours, $2.83 million in short positions were liquidated compared to $1.47 million in longs. The 2:1 ratio favoring short liquidations indicates that bears are getting squeezed on bounces from support.
The long/short ratio sits at 0.98, nearly balanced. Top traders on Binance show 3.14 long/short ratio, indicating larger accounts remain positioned for upside despite the bearish price structure.
Options open interest rose slightly by 0.36% to $71.52 million while volume dropped 68.94%, suggesting that hedging activity has declined as the pattern approaches its apex.
Descending Triangle Approaches Resolution
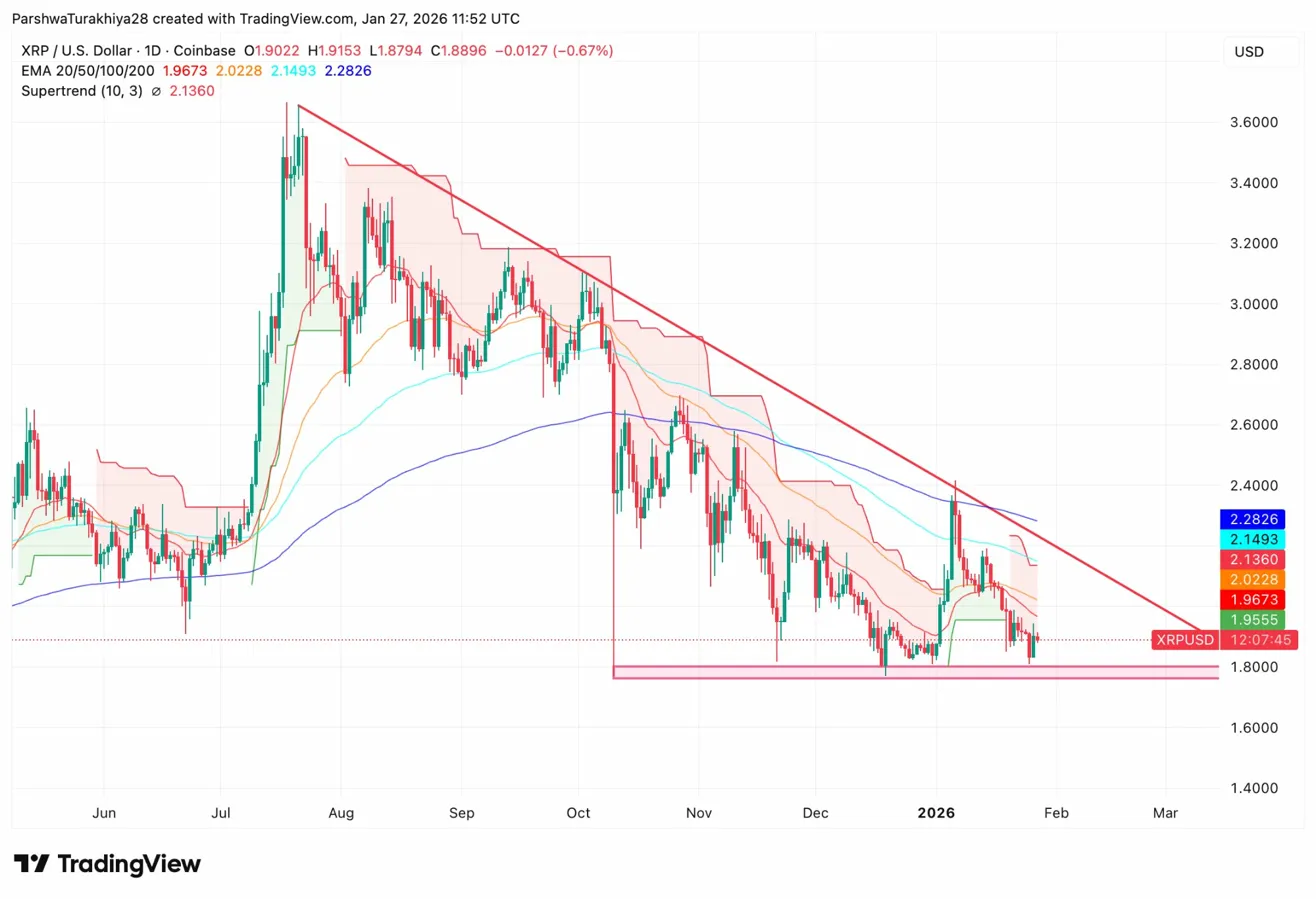
On the daily chart, XRP has traded inside a descending triangle since October. Lower highs compress against horizontal support at $1.80, creating a pattern that typically resolves with breakdowns.
However, descending triangles can also break higher when strong support repeatedly absorbs selling pressure. The $1.80 level has held through six separate tests over four months, demonstrating significant buyer interest.
Key levels now:
- Immediate resistance: $1.9673 (20 EMA)
- Secondary resistance: $2.0228 (50 EMA)
- Supertrend resistance: $2.1360
- Triangle resistance: $1.95 to $2.00
- Critical support: $1.80
- Breakdown target: $1.50 to $1.60
- Breakout target: $2.20 to $2.30
The triangle apex arrives in early February. Resolution before then is likely as compression reaches its limit.
Intraday Structure Shows Potential Reversal
Shorter timeframes reveal a potential bullish setup. On the hourly chart, XRP appears to be forming an inverse head and shoulders pattern with the head at $1.80 and shoulders near $1.85.
The Parabolic SAR sits at $1.9135, just above current price. A close above this level would flip the indicator bullish and confirm the intraday reversal pattern.
RSI sits at 44.88, neutral but improving from oversold conditions hit during the January 25 selloff to $1.80. The indicator has room to run before reaching overbought territory.
The neckline of the potential inverse head and shoulders sits near $1.92. A break above this level would target $2.00 to $2.05 based on the pattern’s measured move.
Outlook: Will Fundamentals Drive A Breakout?
The setup shows improving fundamentals meeting a bearish technical pattern. The $1B tokenized assets milestone demonstrates real utility, while the descending triangle statistically favors breakdowns. Resolution will determine whether fundamentals or technicals win.
- Bullish case: Price breaks above $1.95 triangle resistance with volume. The $1B XRPL milestone attracts institutional interest and drives a rally toward $2.20.
- Bearish case: The triangle breaks down through $1.80 support after the sixth test fails. A close below $1.80 confirms the pattern and targets $1.50 to $1.60.