coinedition.com
$XRP price today trades near $1.3475, down 1.09% after testing the Supertrend support at $1.3273. The move places buyers at a critical level as open interest collapses and historical data suggests March typically delivers negative returns.
Open Interest Crashes 5.68% As Volume Collapses
Open interest crashed 5.68% to $2.14 billion while volume collapsed 32.39% to $4.24 billion. The combination signals reduced participation and deleveraging as traders exit positions at key technical levels.
Total liquidations hit $873.05K, with shorts accounting for $831.36K. The long/short ratio on Binance sits at 2.08 for accounts and 2.32 for top traders, showing leverage remains tilted bullish despite the asymmetric short flush.
Options volume dropped 57.54% to $2.18 million while options OI rose 0.83% to $46.22 million. The collapse in options volume reflects reduced hedging activity as traders wait for direction.
Daily Chart Shows Volume Profile Support At $1.20 To $1.40
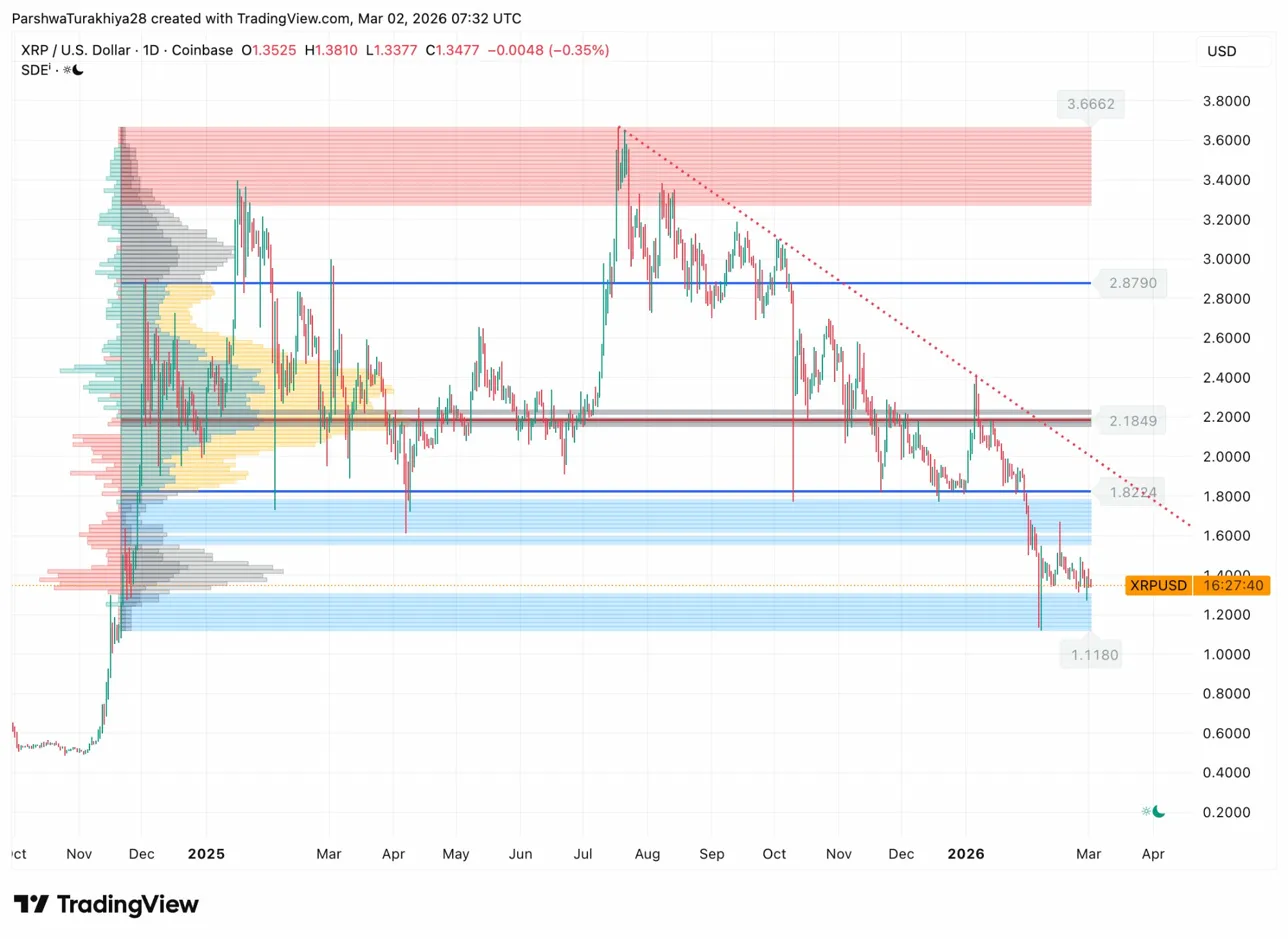
The daily chart shows $XRP trading within a high-volume node (blue shaded area) between $1.20 and $1.60, where significant trading activity has occurred over the past year. The volume profile on the left shows this zone represents the point of control where most price discovery happened.
Related: Hyperliquid Price Prediction: Can HYPE Reclaim $32.73 After Trend Slowdown?
A descending trendline (red dotted line) has capped rallies since the July 2025 highs near $3.66. Recent attempts to break above this trendline have failed, keeping price trapped in the downtrend. Multiple resistance levels sit above at $1.82, $2.18, and $2.87.
The current consolidation near $1.35 sits in the middle of the high-volume node. A break below $1.20 would exit this zone and expose the low-volume area (gray shaded) between $1.00 and $1.20, where price could fall quickly due to lack of support.
Key levels:
- High-volume support zone: $1.20 to $1.40
- Low-volume gap: $1.00 to $1.20
- First resistance: $1.82
- Major resistance: $2.18
- Descending trendline: $1.70 to $1.80
Intraday Structure Tests Fibonacci Support
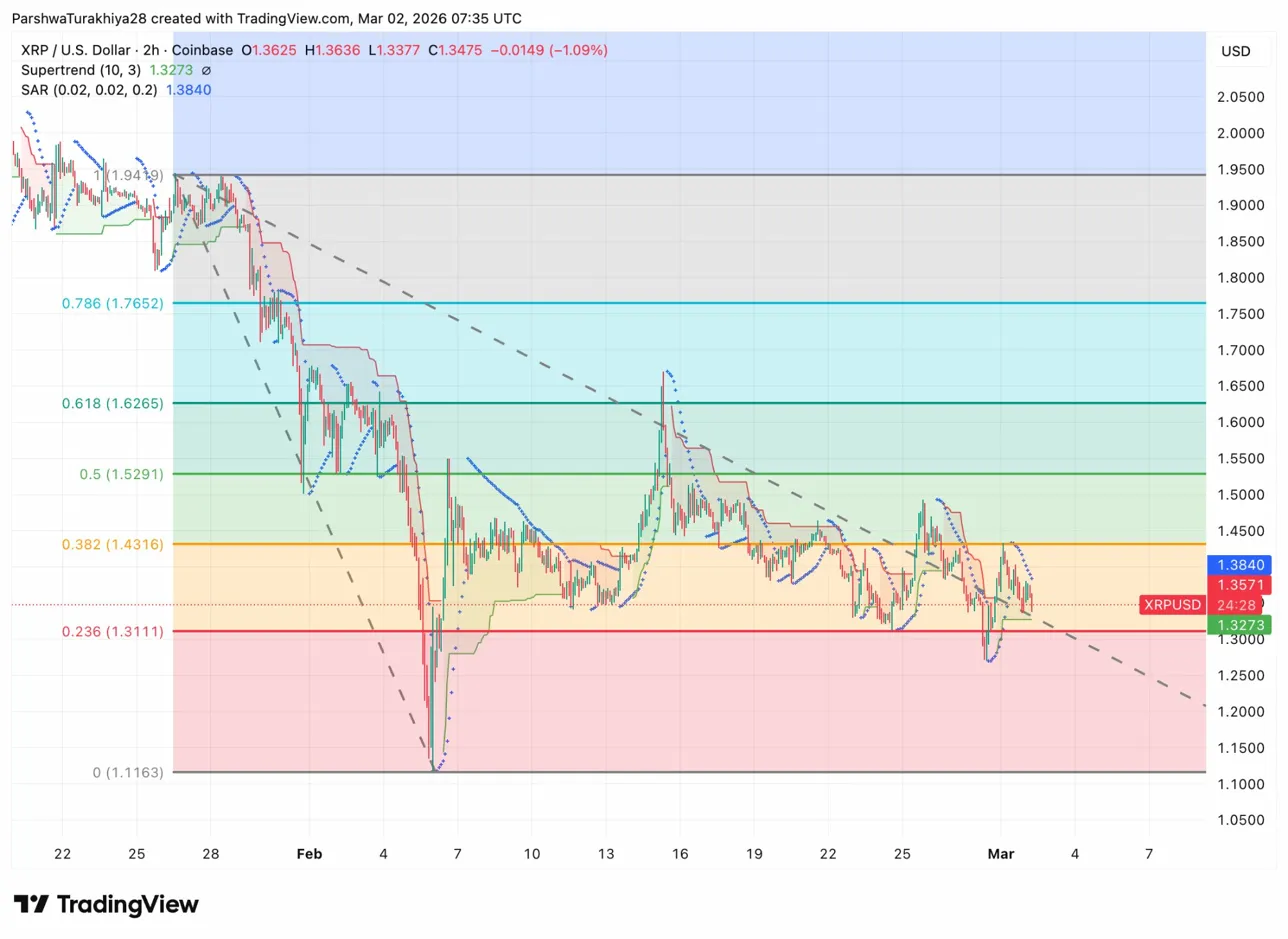
The 2-hour chart shows $XRP testing the 0.382 Fibonacci retracement level at $1.4316 (orange zone). The Supertrend at $1.3273 provides immediate support, while the Parabolic SAR at $1.3840 acts as resistance above current price.
Price bounced from the $1.3111 low (0.236 Fibonacci level) in late February and is now consolidating between the 0.382 and 0.5 Fibonacci levels. The 0.618 level at $1.6265 and 0.786 level at $1.7652 represent the next major resistance zones if buyers can reclaim momentum.
Related: Solana Price Prediction: Polymarket Prices 86% Odds Of Sub-$80 – Will $83 Break?
A descending channel (dashed gray lines) has guided price lower since late January. $XRP is currently trading near the lower boundary of this channel, suggesting either a bounce back toward the upper boundary near $1.50 or a breakdown below channel support.
Historical Data Shows March Averages Negative Returns

Historical data shows $XRP averages -2.37% returns in March, with the median also sitting at -2.37%. The month has delivered negative returns in 8 out of 13 years since 2013, including the past two consecutive Marches.
2026 year-to-date performance shows January down 10.6%, February down 16.2%, and March currently tracking -2.37%. This marks three consecutive months of losses, placing 2026 among the weaker years in $XRP’s history.
The worst March performances occurred in 2018 (-43.3%), 2015 (-40.2%), and 2014 (-35.8%). The best March performances happened in 2017 (+278.1%), 2023 (+43%), and 2021 (+37.7%).
Outlook: Will $XRP Go Up?
The next move depends on whether $XRP can hold the Supertrend support at $1.3273 or if sellers push through to test the low-volume gap below $1.20.
- Bullish case: $XRP defends $1.3273 and breaks above $1.3840 with rising volume. That reclaims the Parabolic SAR and targets the 0.5 Fibonacci level at $1.5291, potentially invalidating the negative March historical trend.
- Bearish case: A daily close below $1.3273 breaks the Supertrend and exposes the high-volume zone floor at $1.20. Losing that level opens the low-volume gap toward $1.10 and aligns with historical March weakness.
Related: Cardano Price Prediction: Trendline Retest at $0.2676 – Is $0.5 The Next Target?