
What Happens To The XRP Price If It Follows The Amazon Trend And Begins Parabola

By:Newsbtc
Bitget offers one-stop trading for cryptocurrencies, stocks, and gold. Trade now!
A welcome pack worth 6200 USDT for new users! Sign up now!
Technical analysis of XRP’s current price action has presented an interesting structural comparison to Amazon that could lead to an upside cycle stretch for the cryptocurrency.
The comparison focuses on structure and symmetry between XRP’s current price action and how Amazon’s stock price played out after it broke a resistance. The implications for price would be dramatic if XRP were to follow what Amazon did after breaking a similar long-term resistance.
The 8-Year Resistance Neckline Holding XRP Back
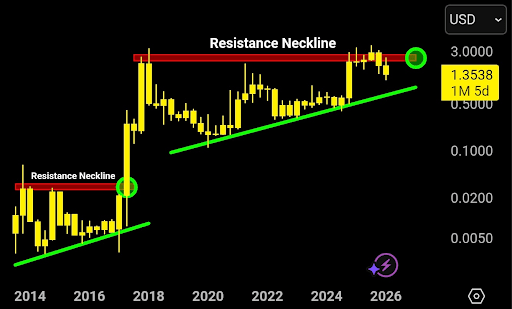
Technical analysis of XRP’s chart shows a clearly defined horizontal resistance band stretching back roughly eight years. This 8-year resistance band is drawn across XRP’s all-time high since 2018. This analysis was posted on the social media platform X by crypto analyst ChartNerd.
var rnd = window.rnd || Math.floor(Math.random()*10e6); var pid607465 = window.pid607465 || rnd; var plc607465 = window.plc607465 || 0; var abkw = window.abkw || ''; var absrc = 'https://servedbyadbutler.com/adserve/;ID=172179;size=0x0;setID=607465;type=js;sw='+screen.width+';sh='+screen.height+';spr='+window.devicePixelRatio+';kw='+abkw+';pid='+pid607465+';place='+(plc607465++)+';rnd='+rnd+';click=CLICK_MACRO_PLACEHOLDER'; document.write('
');
if (!window.AdButler){(function(){var s = document.createElement("script"); s.async = true; s.type = "text/javascript";s.src = "https://servedbyadbutler.com/app.js";var n = document.getElementsByTagName("script")[0]; n.parentNode.insertBefore(s, n);}());}
var AdButler = AdButler || {}; AdButler.ads = AdButler.ads || []; var abkw = window.abkw || ""; var plc366606 = window.plc366606 || 0; (function(){ var divs = document.querySelectorAll(".plc366606:not([id])"); var div = divs[divs.length-1]; div.id = "placement_366606_"+plc366606; AdButler.ads.push({handler: function(opt){ AdButler.register(172179, 366606, [728,90], "placement_366606_"+opt.place, opt); }, opt: { place: plc366606++, keywords: abkw, domain: "servedbyadbutler.com", click:"CLICK_MACRO_PLACEHOLDER" }}); })();
The most recent touch of the resistance band was in July 2025, when XRP reached a new peak price of $3.65. However, price action since then has been corrective in nature, and XRP has been on a downward path for the past seven months. Interestingly, this downward path has led to the formation of a higher low compared to lows in the past eight years. This is visible in the XRP weekly price chart below as a series of higher lows supported by an ascending green trendline.
 Source:
Chart from ChartNerd on X
The next outlook is how the XRP price resolves from here. As it stands, the decline is yet to find a defined bottom, and there is still enough room for the formation of another higher low relative to prior cycle lows. In this context, crypto analyst ChartNerd outlined a possible resolution path, pointing to a comparable technical setup that developed over 10.5 years on Amazon’s stock chart before its eventual breakout.
The Amazon Structural Comparison
Amazon spent years trading below a major horizontal resistance zone that capped its upside for more than a decade. During that period, price repeatedly formed higher lows along a rising support trendline, compressing into the ceiling without immediately breaking it.
var rnd = window.rnd || Math.floor(Math.random()*10e6); var pid607472 = window.pid607472 || rnd; var plc607472 = window.plc607472 || 0; var abkw = window.abkw || ''; var absrc = 'https://servedbyadbutler.com/adserve/;ID=172179;size=0x0;setID=607472;type=js;sw='+screen.width+';sh='+screen.height+';spr='+window.devicePixelRatio+';kw='+abkw+';pid='+pid607472+';place='+(plc607472++)+';rnd='+rnd+';click=CLICK_MACRO_PLACEHOLDER'; document.write('
');
if (!window.AdButler){(function(){var s = document.createElement("script"); s.async = true; s.type = "text/javascript";s.src = "https://servedbyadbutler.com/app.js";var n = document.getElementsByTagName("script")[0]; n.parentNode.insertBefore(s, n);}());}
var AdButler = AdButler || {}; AdButler.ads = AdButler.ads || []; var abkw = window.abkw || ""; var plc452518 = window.plc452518 || 0; (function(){ var divs = document.querySelectorAll(".plc452518:not([id])"); var div = divs[divs.length-1]; div.id = "placement_452518_"+plc452518; AdButler.ads.push({handler: function(opt){ AdButler.register(172179, 452518, [728,90], "placement_452518_"+opt.place, opt); }, opt: { place: plc452518++, keywords: abkw, domain: "servedbyadbutler.com", click:"CLICK_MACRO_PLACEHOLDER" }}); })();
What Happens To The XRP Price If It Follows The Amazon Trend And Begins Parabola
There was also a notable drawdown from its prior peak, followed by a lower high, which created the impression that momentum had faded. However, once Amazon broke above its long-term resistance, the result was a sustained parabolic advance that carried price significantly higher over time.
These all mirror how the XRP price is currently playing out. ChartNerd describes the structural similarities as strikingly uncanny. From a purely technical standpoint, both charts show compression beneath a horizontal ceiling, rising higher lows, and repeated rejection just before a breakout attempt.
At the time of writing, XRP is trading around $1.35 on the monthly chart, down by 3.3% in the past 24 hours. The neckline area is around $3.60, which is about 170% higher than the current price. If XRP were to follow the Amazon blueprint, the first stage would involve flipping this resistance trendline into support with sustained monthly closes above.
var rnd = window.rnd || Math.floor(Math.random()*10e6); var pid607473 = window.pid607473 || rnd; var plc607473 = window.plc607473 || 0; var abkw = window.abkw || ''; var absrc = 'https://servedbyadbutler.com/adserve/;ID=172179;size=0x0;setID=607473;type=js;sw='+screen.width+';sh='+screen.height+';spr='+window.devicePixelRatio+';kw='+abkw+';pid='+pid607473+';place='+(plc607473++)+';rnd='+rnd+';click=CLICK_MACRO_PLACEHOLDER'; document.write('
');
if (!window.AdButler){(function(){var s = document.createElement("script"); s.async = true; s.type = "text/javascript";s.src = 'https://servedbyadbutler.com/app.js';var n = document.getElementsByTagName("script")[0]; n.parentNode.insertBefore(s, n);}());}
var AdButler = AdButler || {}; AdButler.ads = AdButler.ads || []; var abkw = window.abkw || ''; var plc452519 = window.plc452519 || 0; (function(){ var divs = document.querySelectorAll(".plc452519:not([id])"); var div = divs[divs.length-1]; div.id = "placement_452519_"+plc452519; AdButler.ads.push({handler: function(opt){ AdButler.register(172179, 452519, [728,90], 'placement_452519_'+opt.place, opt); }, opt: { place: plc452519++, keywords: abkw, domain: 'servedbyadbutler.com', click:'CLICK_MACRO_PLACEHOLDER' }}); })();
 XRP trading at $1.35 on the 1D chart | Source: XRPUSDT on
Tradingview.com
0
0
Disclaimer: The content of this article solely reflects the author's opinion and does not represent the platform in any capacity. This article is not intended to serve as a reference for making investment decisions.
Understand the market, then trade.
Bitget offers one-stop trading for cryptocurrencies, stocks, and gold.
Trade now!
You may also like
 VIPCross-Asset Positioning Amid AI Earnings Scrutiny and the US Election
1. Markets diverged during the week. Between the October 23 and October 30 closes, BTC fell 4.78%, the Nasdaq 100 declined 1.98%, and gold and silver dropped 2.72% and 8.59%, respectively. The DAX, KOSPI, Nikkei 225 and Hang Seng advanced. We focus on differences in growth prospects, valuation sensitivity and risk exposures rather than applying a single directional view across assets. 2. Market reactions to Alphabet's and Intel's earnings brought returns on AI investment into focus. Attention is shifting from the scale of capital expenditure to revenue realization, margins and free cash flow. Lower interest rates can ease discount-rate pressure, but a sustained valuation recovery still requires support from both operating performance and financing conditions. 3. The November 3 US midterm elections and November 6 employment report are key events in the coming week. We monitor how post-election fiscal and legislative agendas may affect interest rates, the dollar and industry operating conditions. Our execution priorities are to manage leverage and concentration, retain margin and exit-liquidity buffers, and avoid treating a single political outcome as an automatic trading signal. 4. Following Binance's disclosure of a security incident, industry attention to endpoint protection, access segregation and coordinated incident response has increased. Key assets to monitor: BTC, the Nasdaq 100, crude oil and gold, alongside upcoming earnings from AAPL, AMD, PLTR, ARM, ANET and QCOM.
Bitget•2026/11/02 08:28

HYATT HOTELS CORP <H.N>: JEFFERIES RAISES TARGET PRICE TO $188 FROM $167
Reuters•2026/11/02 07:58
Italgas Raised to Buy From Hold by Berenberg
Dow Jones•2026/11/02 06:37
BANCORP INC <TBBK.O>: KBW CUTS TARGET PRICE TO $56 FROM $65
Reuters•2026/11/02 06:28
Crypto prices
More
Bitcoin
BTC
$78,175.09
+0.14%

Ethereum
ETH
$2,296.36
+1.11%

Tether USDt
USDT
$0.9986
-0.01%

BNB
BNB
$709.52
+0.07%

XRP
XRP
$1.25
+0.10%

USDC
USDC
$0.9996
-0.00%

Solana
SOL
$94.61
-1.16%

TRON
TRX
$0.3155
+1.68%

Hyperliquid
HYPE
$86.65
-1.66%

Zcash
ZEC
$1,262.37
+0.97%
How to buy BTC
Bitget lists BTC – Buy or sell BTC quickly on Bitget!
Trade now
Become a trader now?A welcome pack worth 6200 USDT for new users!
Sign up now