Solana’s derivatives market saw a major cleanup of leveraged long positions after a liquidation wave cleared crowded exposure below key price levels. At the same time, the $SOL/$BTC pair is testing a rising trendline again after a failed breakout attempt, placing the next structural move in focus.
$SOL Long Liquidations Largely Cleared After Sharp Flush
Most leveraged long positions in Solana ($SOL) were liquidated after price moved through a dense liquidation zone, according to a heatmap shared by analyst CW on X. The chart places $SOL near $82.8 and shows that the biggest long liquidation clusters sat below that level, mainly between $80 and $83.

Solana Liquidation Heatmap. Source: CoinAnk / X
The data combines positions from Binance, Bybit, OKX, Aster, Hyperliquid, and Lighter. The tallest liquidation bars appear around $80 to $81, showing where leveraged longs were concentrated before the drop. Once $SOL entered that range, forced liquidations hit quickly and removed much of that exposure.
Now, only a small amount of long liquidity remains near the current price. That suggests the market has already cleared most crowded bullish bets on the downside. At the same time, the chart shows a larger band of possible short liquidations above the market, stretching toward the $90 to $97 area.
The heatmap does not predict direction. However, it shows that downside long pressure has mostly been exhausted, while larger liquidation pools now sit higher. That leaves $SOL in a market structure with less long leverage below and more potential short pressure above.
$SOL/$BTC Retests Rising Trendline After Failed Breakout Attempt
The $SOL/$BTC pair returned to its rising trendline after an earlier breakout attempt failed, according to chart analysis shared by gnarleyquinn on X. The daily Coinbase chart shows Solana moving inside a tightening structure where a rising support line meets a horizontal resistance band.
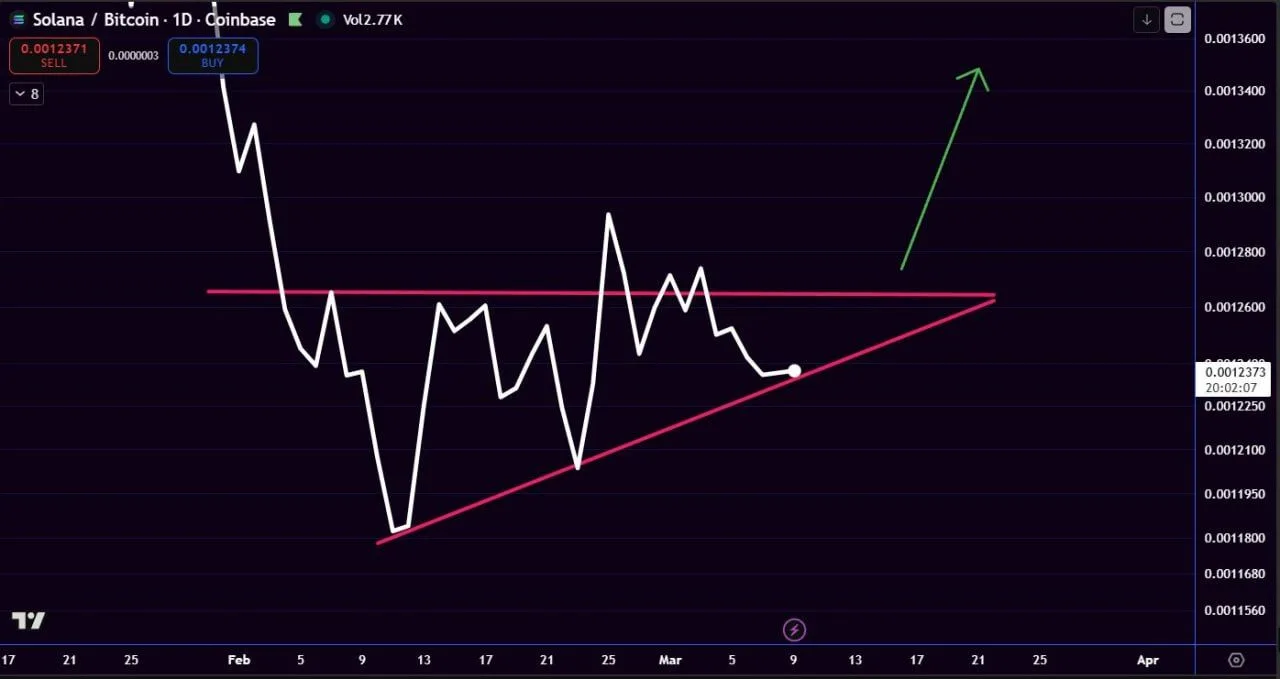
$SOL/$BTC Ascending Trend Structure. Source: X
Earlier, the pair attempted to break above the resistance area marked by the horizontal red line. However, the move did not hold, and price moved back into the pattern. After the rejection, $SOL/$BTC declined toward the upward trendline that has supported the structure since mid February.
The rising trendline continues to connect a series of higher lows, indicating that buyers have defended that level during each pullback. As price returned to this support, the chart suggests the pair is testing whether that structure can hold again before another move develops.
The pattern now resembles a symmetrical compression between rising support and horizontal resistance. In such formations, price action often tightens before a directional move occurs. The chart highlights the resistance zone above as the level that previously stopped the breakout attempt.
According to the analyst, the market may attempt another push toward that resistance area if the upward trendline continues to hold. The structure shows price consolidating between these two boundaries while volatility gradually compresses.