
Bitcoin may hit $110K as Strategy absorbs nearly 3x new BTC supply

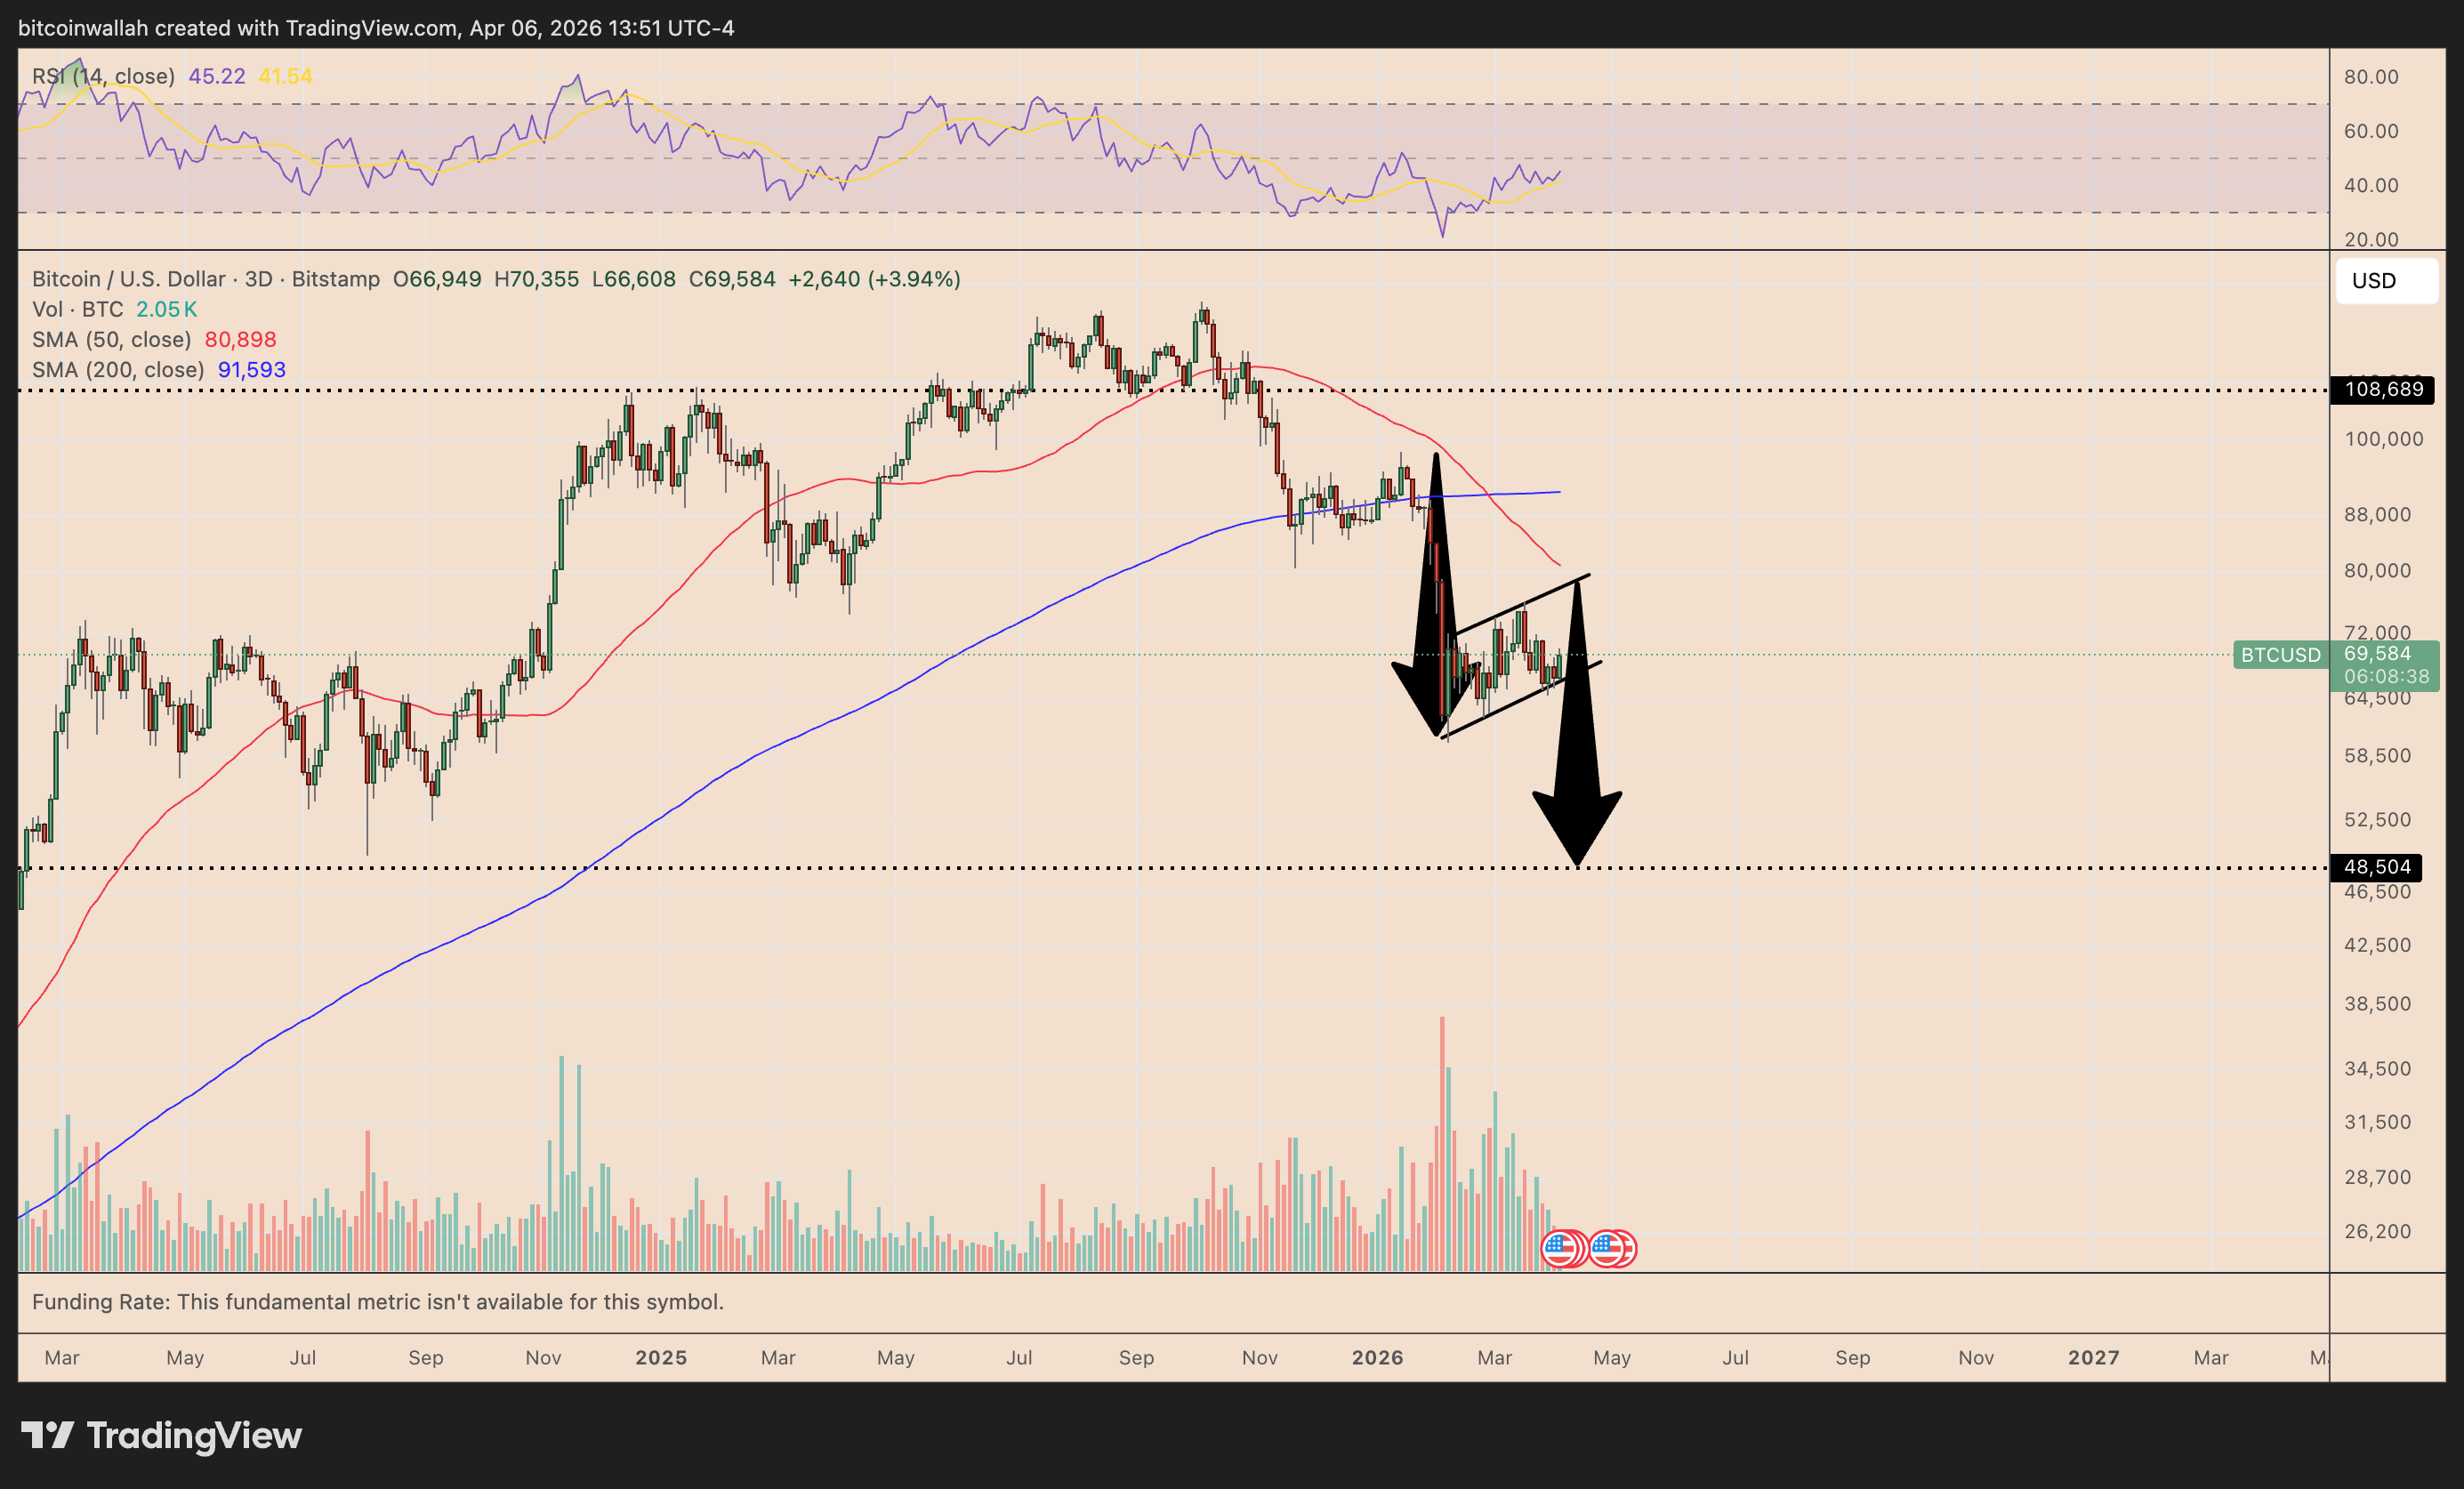
Bitcoin (BTC) is trading within a bear flag pattern that projects a breakdown toward the sub-$50,000 area, or roughly 30% below current levels. However, Michael Saylor’s Strategy could spoil the bears’ plans.
 BTC/USD three-day price chart. Source:
TradingView
Key takeaways:
Bitcoin has avoided a bear flag breakdown for weeks as Strategy keeps buying BTC.
The setup now resembles Bitcoin’s 2018 bottom, when a bearish pattern failed and triggered a reversal.
Can Strategy’s BTC buying offset weak technicals?
Normally, a bear flag remains a bearish continuation pattern because there is not enough demand to overcome the broader downtrend.
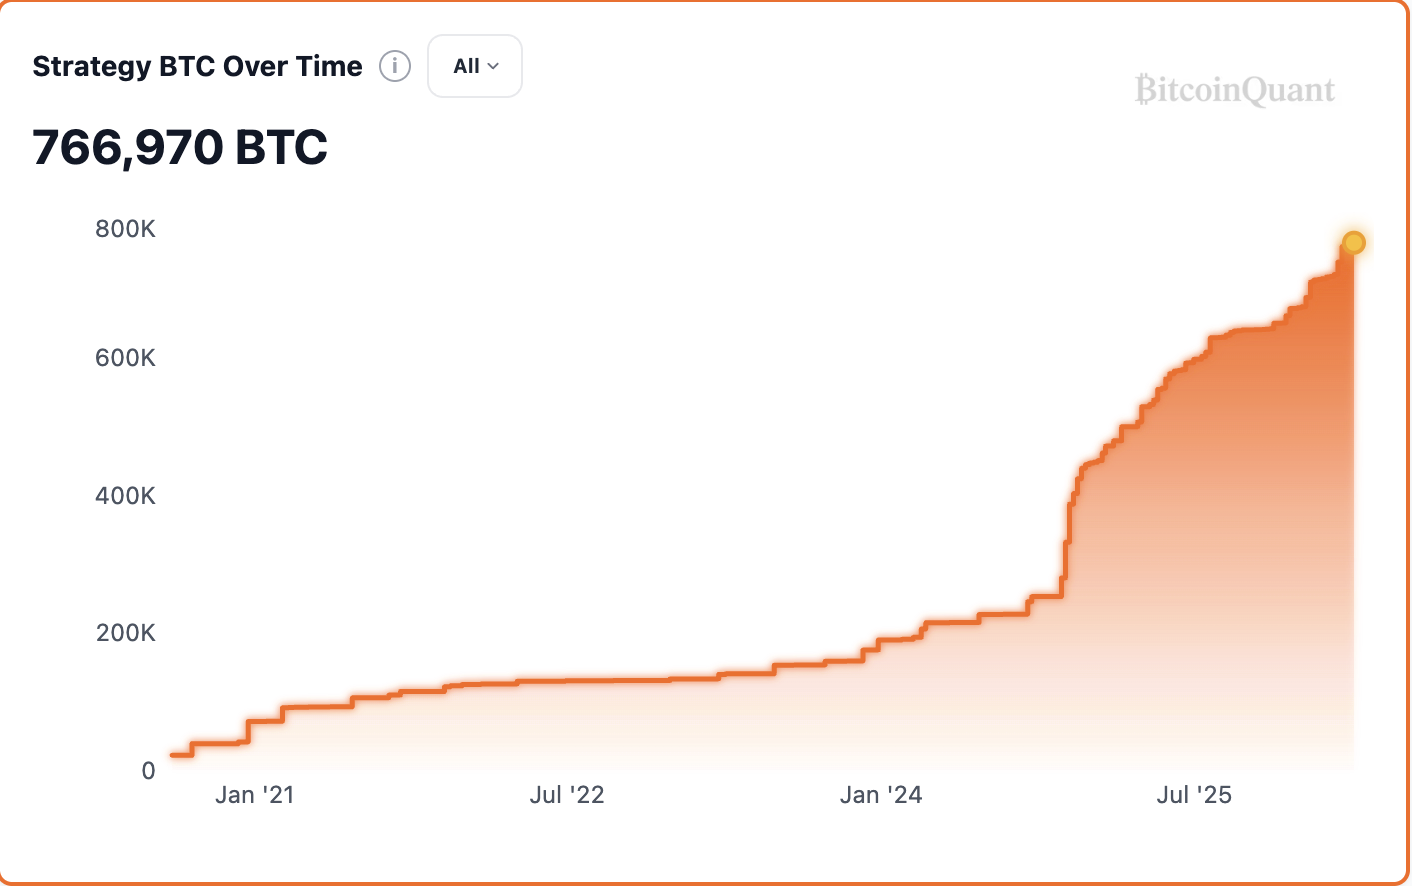
In Bitcoin’s case, however, Strategy has been taking supply off the market faster than miners can replace it.
Since March 2, Strategy’s Bitcoin holdings have risen by 46,233 BTC, while miners have produced only about 16,200 BTC over the same period, meaning it has absorbed nearly thrice the new supply.
 Strategy’s BTC holdings chart. Source:
BitcoinQuant.CO
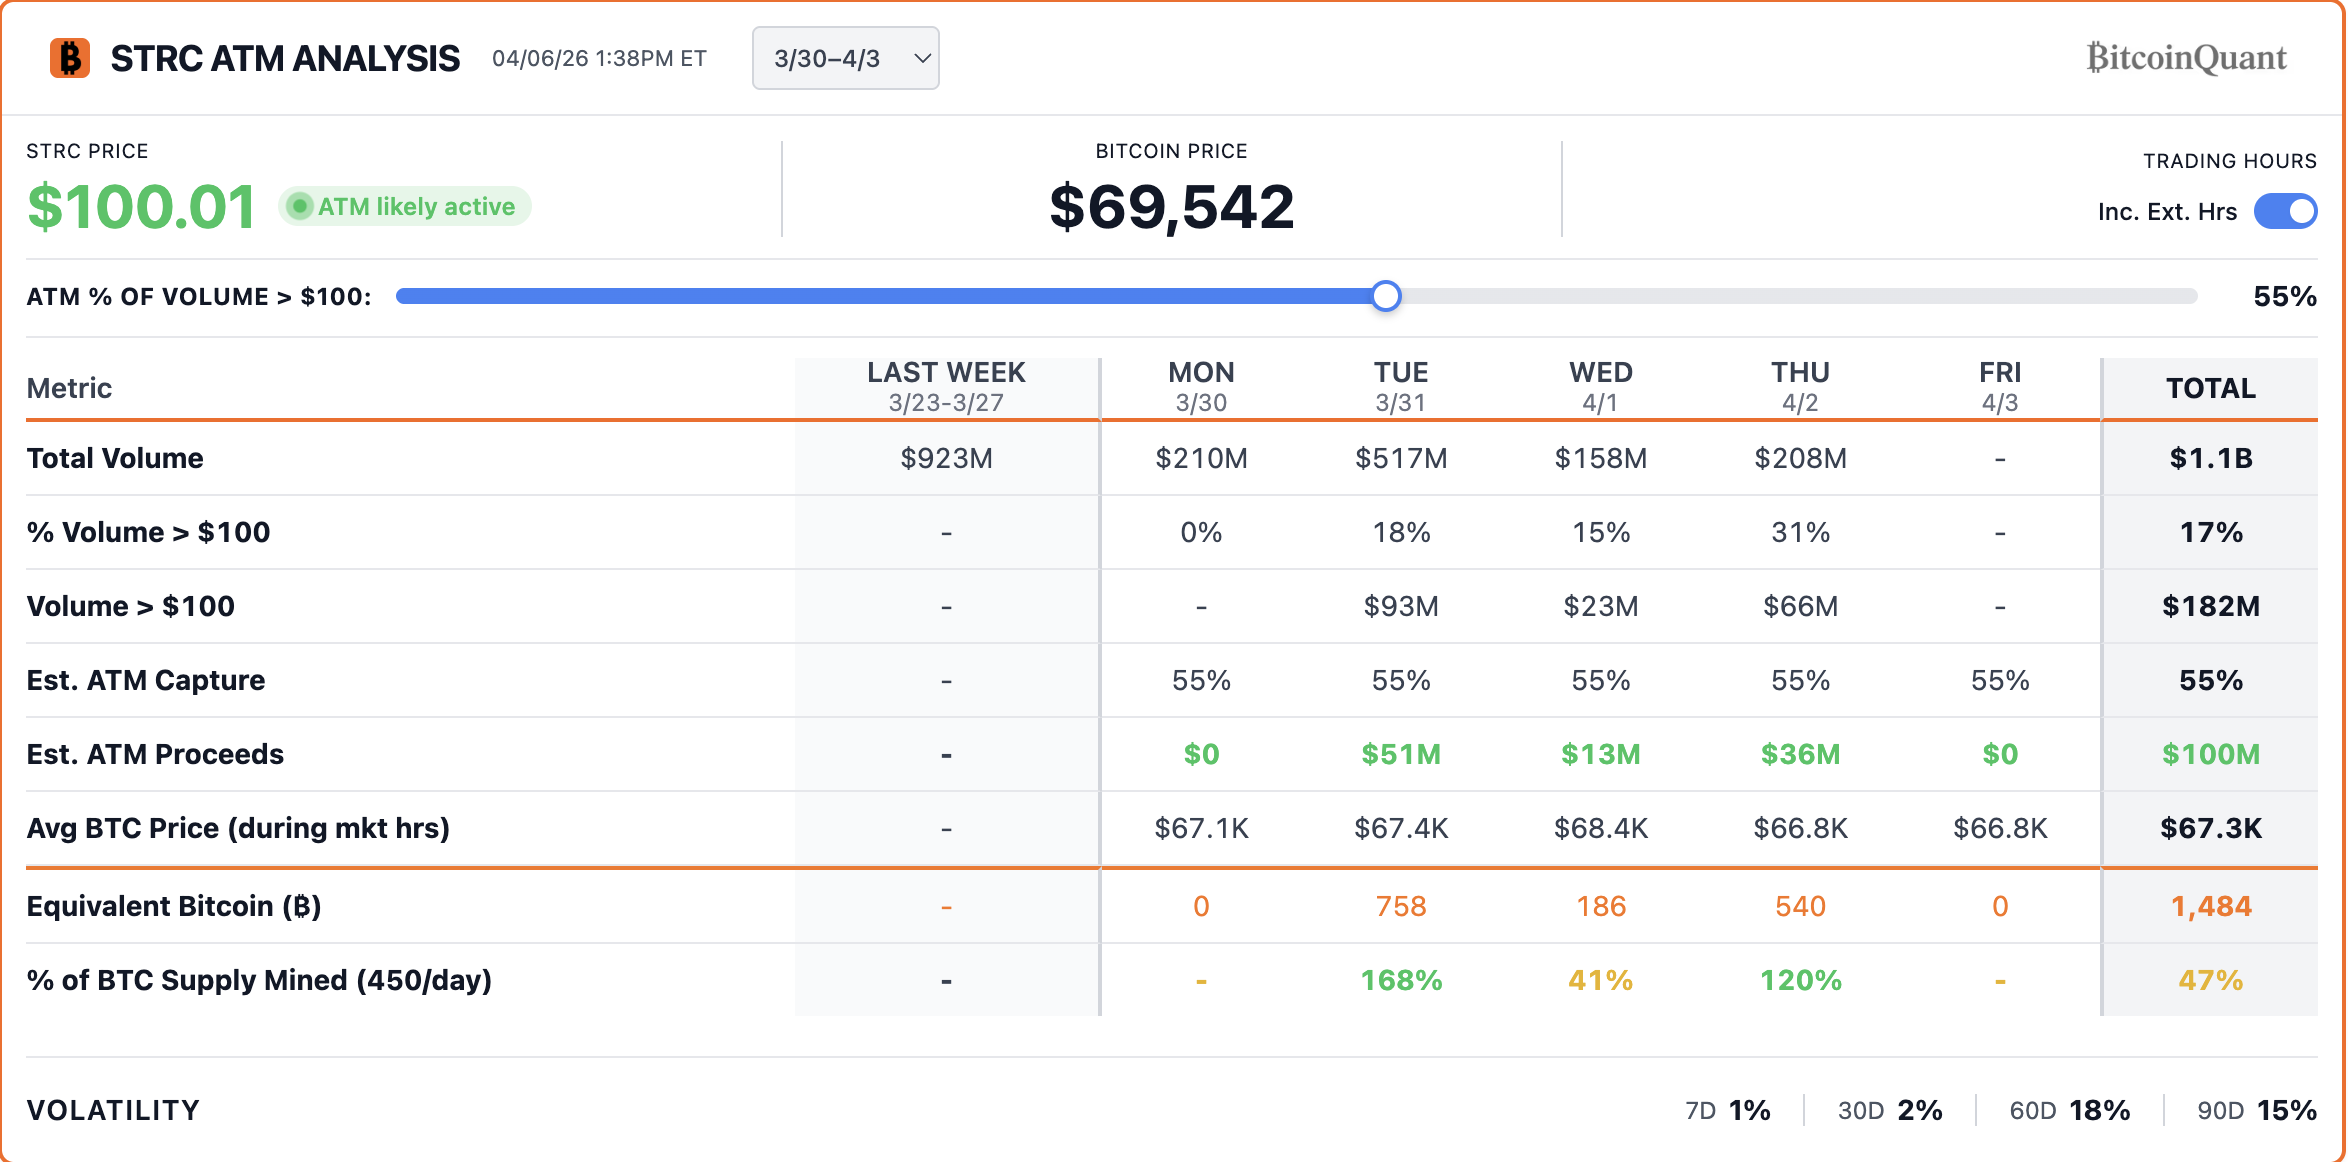
Much of that demand has come through STRC, Strategy’s variable-rate preferred stock. When STRC held near or above its $100 par value, Strategy kept issuing shares and accumulating BTC.
For instance, last week, Strategy raised $102.6 million through STRC sales to help fund a Bitcoin purchase worth over $330 million. BTC’s price has jumped by over 6.65% ever since.
 STRC at-the-market sales analysis. Source: BitcoinQuant.CO
During March 9–13, STRC sales raised about $776 million, enough to buy over 11,000 BTC, while Bitcoin rose more than 7% even as the S&P 500 fell 1.6%. The same period saw BTC’s price rising over 10.5%.
But when STRC slipped below par in mid-March, issuance slowed. Earlier below-par episodes had coincided with 25%–40% BTC pullbacks, including a nearly 40% drop over three weeks after a January pause.
Bitcoin’s long-term holders and whales drove much of the selling.
Bear flag failure could set stage for rally to $110,000
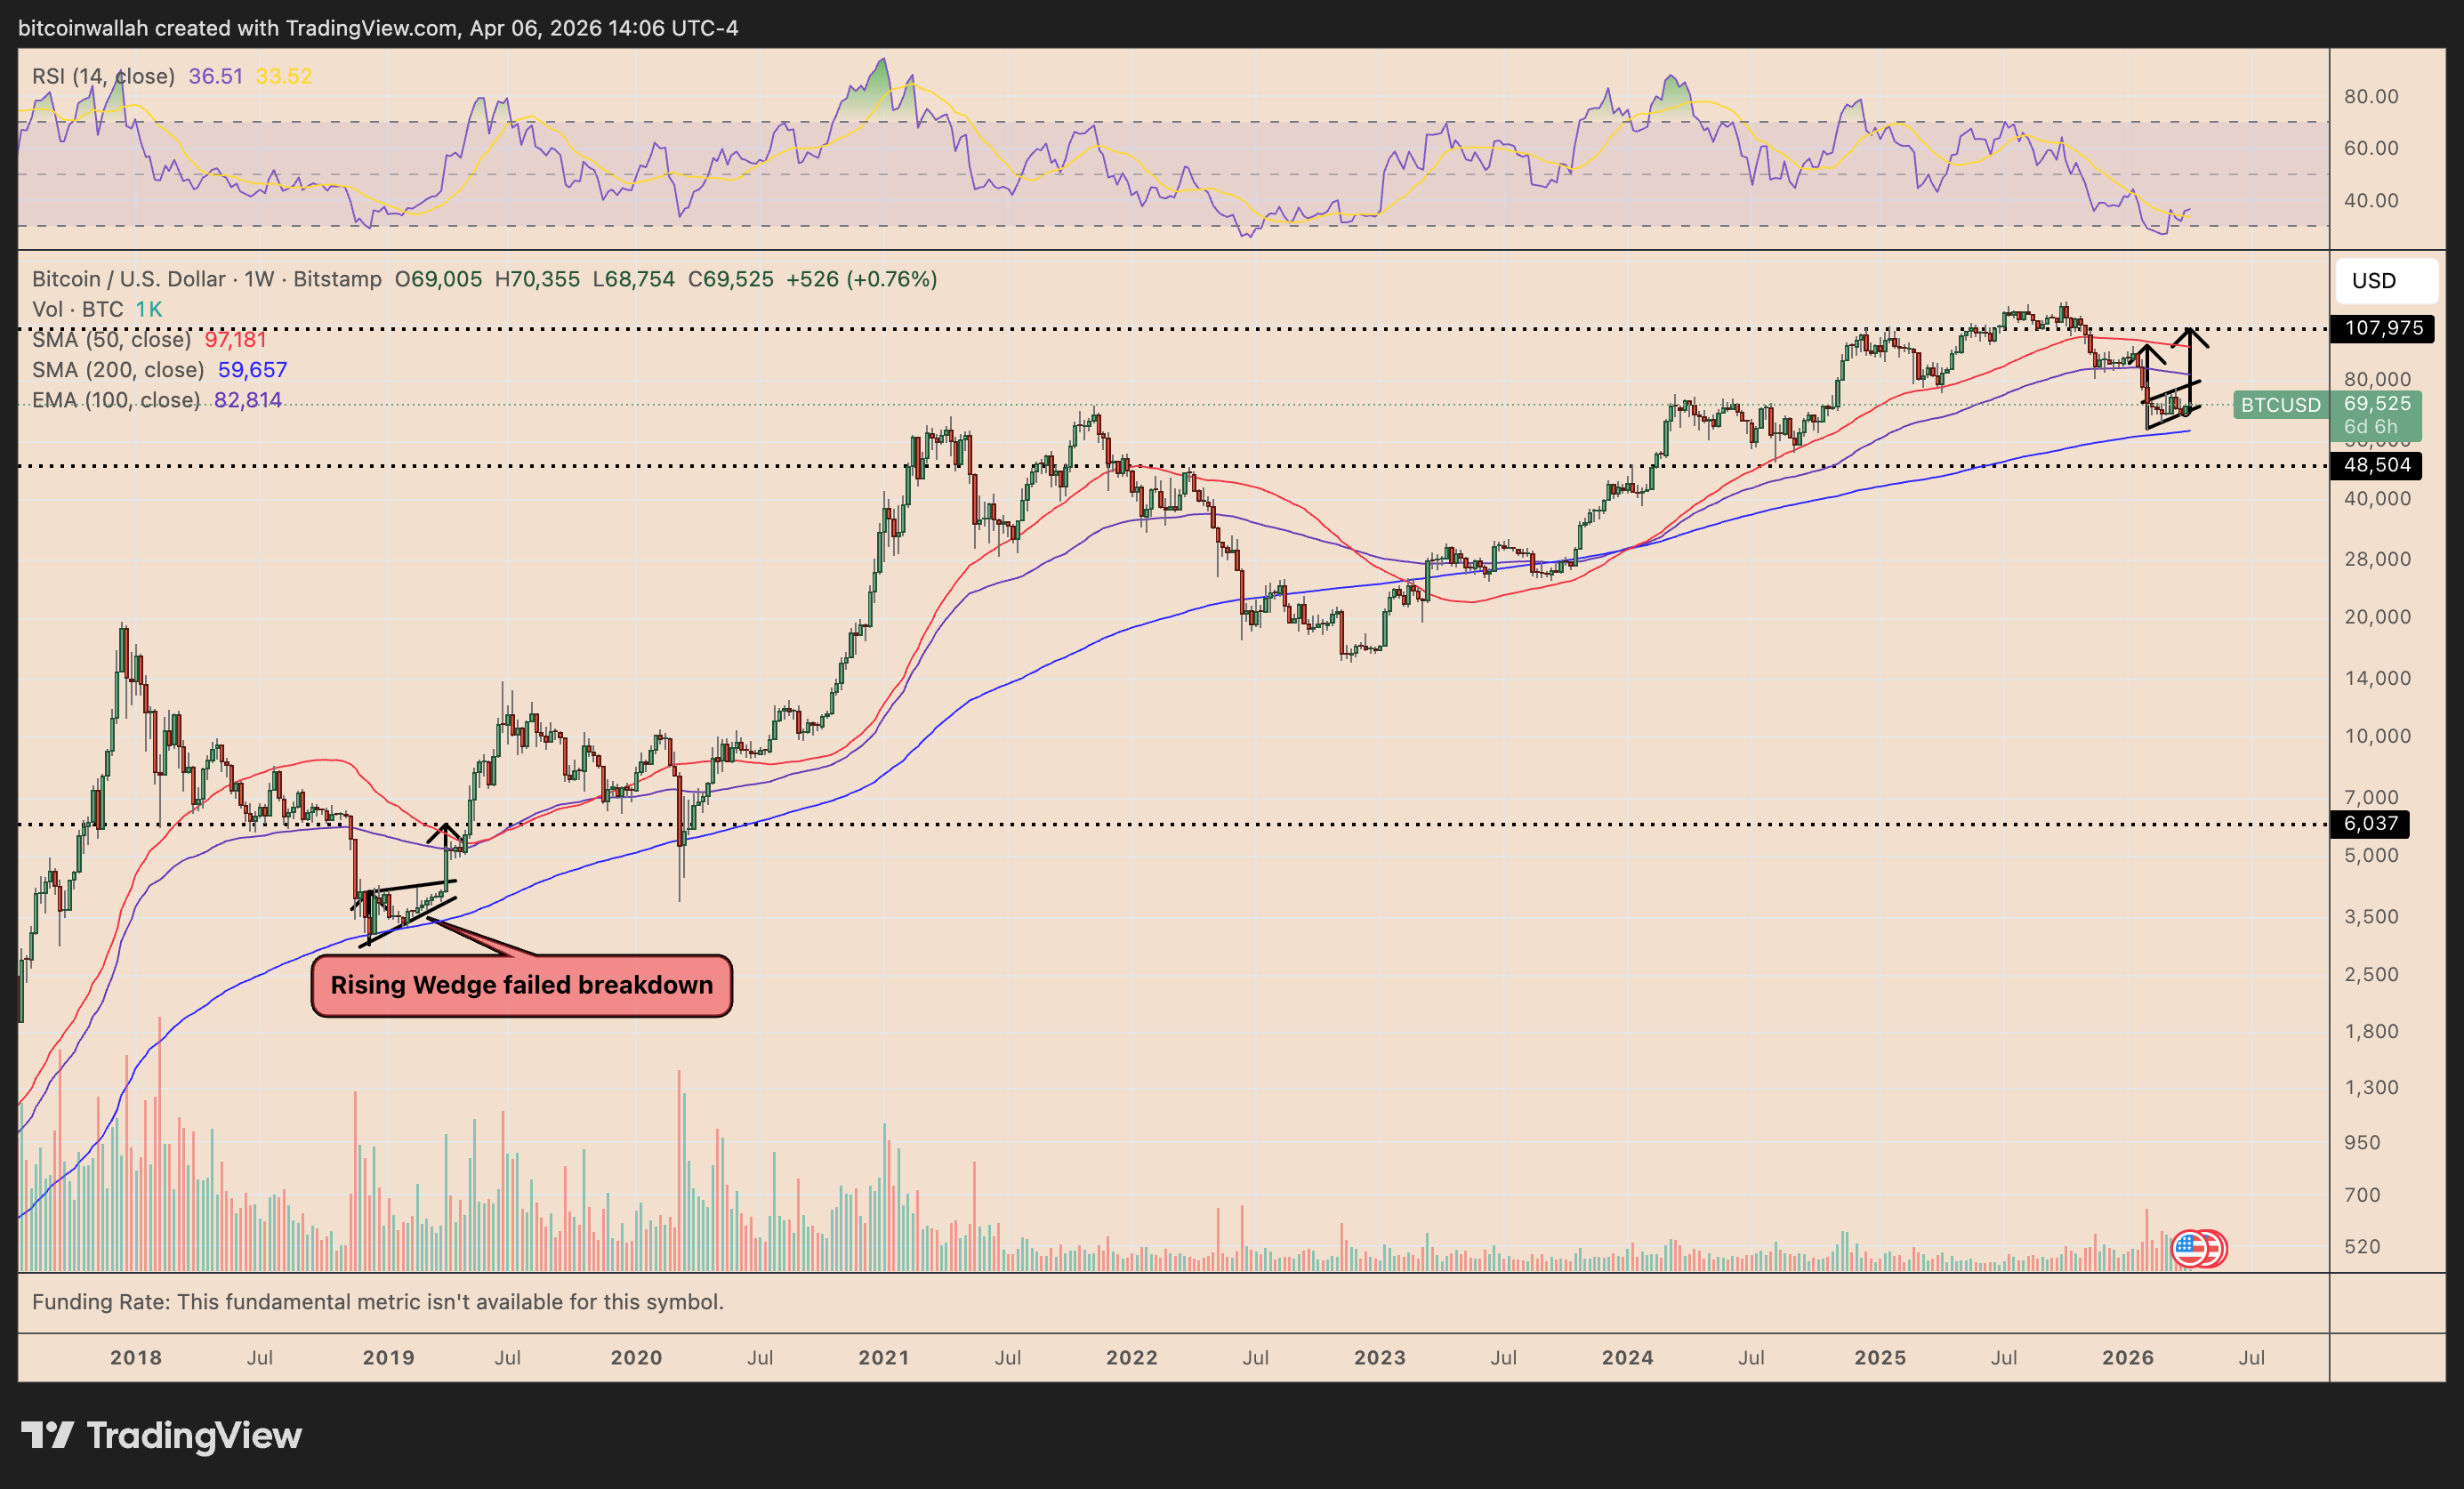
Bitcoin remains inside a bear flag after a sharp decline, but the pattern would begin to fail if price breaks above the upper trendline near the mid-$70,000 area.
That breakout would invalidate the immediate bearish continuation setup and shift focus to the bullish measured-move target near $108,000-$110,000.
 BTC/USD weekly price chart. TradingView
A similar pattern failure occurred near Bitcoin’s 2018 bottom, when a rising wedge pattern led to a breakout instead of a breakdown.
Another factor supporting the upside case is Bitcoin’s position near its 200-week simple moving average (200-week SMA, the blue wave). In 2018, Bitcoin bottomed out near this level and rose by over 1,975% afterward.
As of 2026, the 200-week SMA has capped Bitcoin’s downside attempts successfully, raising the odds of a 2018-like bottom formation.
Related: Strategy’s STRC stock trading surge: How much Bitcoin can Saylor buy?
Some analysts anticipate BTC to rise to $400,000 if Strategy continues buying BTC at its current rate.
Disclaimer: The content of this article solely reflects the author's opinion and does not represent the platform in any capacity. This article is not intended to serve as a reference for making investment decisions.
You may also like
The "Goldilocks" market may have ended! Citi model turns bearish on tech stocks, funds shift sharply to defensive sectors
Citi's latest research report indicates that its fund flow model has completed a decisive divestment from the technology sector, establishing materials, communication services, and healthcare as the preferred long positions, while moving the technology sector into net short territory.

NYSE Adds Four Transfer Agents to Planned Tokenized Securities Venue

US Midterm Elections, How Does the Market View Today
The outcome of the US midterm elections, with the Democratic Party winning the House of Representatives, has already been priced in by the market. The real variable is the Senate—Democrats need a net gain of four seats. The most probable scenario, a "Democratic sweep," would actually be the least favorable for the stock market. Bank of America considers it a risk event that could cause a drop of over 10%. The first signal will be seen at 8:30 AM Beijing time on November 4th when the votes in Ohio are counted; votes from Texas, Michigan, Kansas, Iowa, and Nebraska will be revealed starting at 10 AM.

Crypto Sentiment Hits Extreme Lows as Open Interest Surges: 5 Altcoins to Accumulate Before the Market Turns

Crypto prices
More


