
Bitget App
Trade smarter
Buy cryptoMarketsTradeFuturesStocksEarnInstitutionAI & More
Mapping XDC’s breakout above KEY range – Can bulls hold above $0.037?

Mapping XDC’s breakout above KEY range – Can bulls hold above $0.037?

CryptoNewsNetCryptoNewsNet2026/05/20 23:03
By:CryptoNewsNet
Back to the list

Mapping XDC’s breakout above KEY range – Can bulls hold above $0.037?

Mapping XDC’s breakout above KEY range – Can bulls hold above $0.037? image 0  6 m
Mapping XDC’s breakout above KEY range – Can bulls hold above $0.037? image 1

$XDC Network [$XDC] ranked as the day’s second‑highest gainer, even as the broader crypto market stayed flat. At press time, $XDC was up more than 14% in 24 hours, reversing its weekly loss into a 9% gain.

Fundamental and on-chain drivers of $XDC Network

$XDC’s short‑term surge was driven by its strategic partnership with Animoca Brands, a leading gaming and venture firm that will serve as an institutional masternode validator. According to Shanlong James Chen, Head of Asia at $XDC Network, the partnership brings funding support, particularly for builders on the chain.

Alongside this collaboration, network expansion was also crucial. For instance, the number of transactions in the past two weeks rose to 749K, as per $XDC Explorer. However, account growth has fallen sharply to zero from an average of 853K since mid-April.

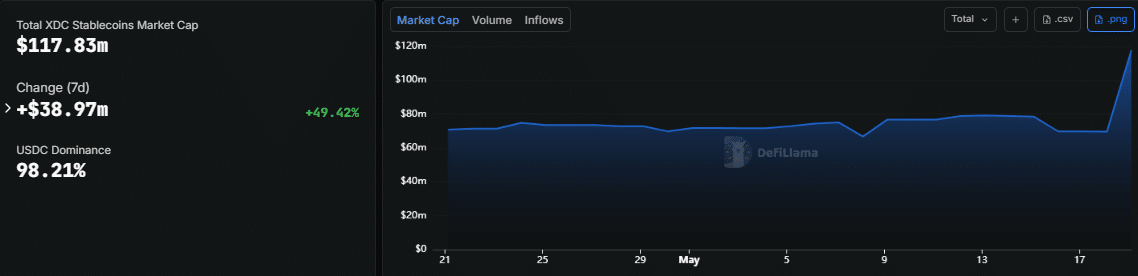
The total stablecoin market cap on the network has also jumped by 49% in a week as of writing. It stood at $118 million, an addition of $39 million in this period. USDC dominates this cap with 98%.
Mapping XDC’s breakout above KEY range – Can bulls hold above $0.037? image 2

The Total Value Locked (TVL) was also up by 12.40% to around $14.78 million in the past 24 hours. Its daily DEX volume was slightly higher than that of the previous day by around $40K, clocking in at about $356K.

$XDC breaks out but stalls on lower timeframes

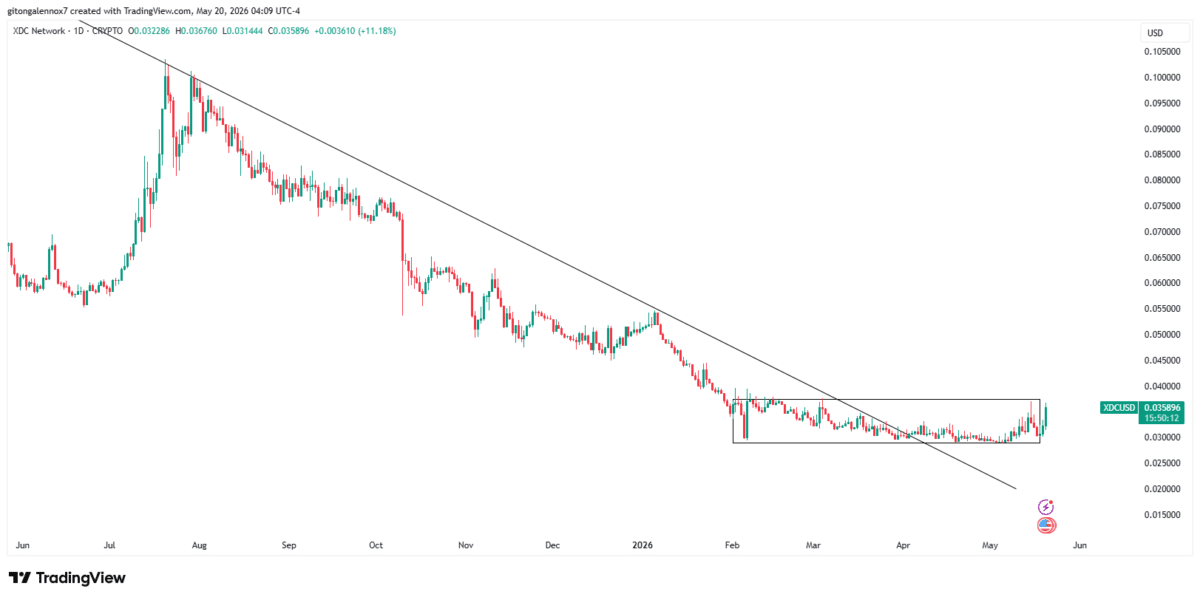
The price charts showed the altcoin had broken out of a descending trendline pattern on the daily timeframe. Even after the breakout, the $XDC price entered a range consolidation.
Mapping XDC’s breakout above KEY range – Can bulls hold above $0.037? image 3 $XDC/ $USDT

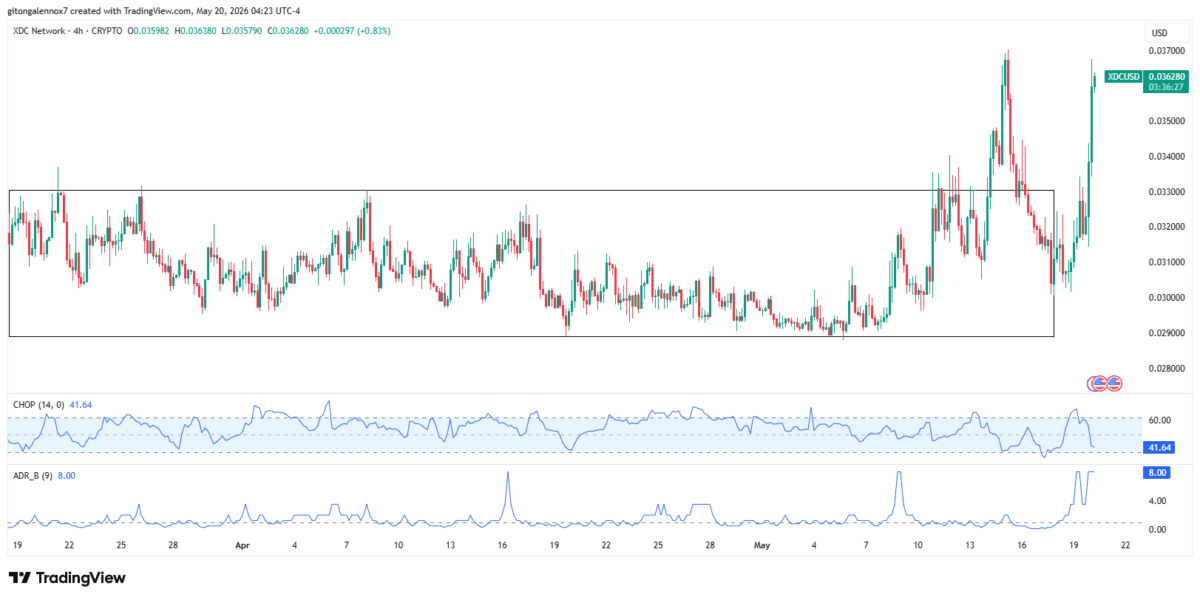
On the 4‑hour chart, $XDC has been trading between $0.02890 and $0.03305 since mid‑March. Earlier this month, an upside breakout was rejected, sending the price back into the range.

At press time, however, $XDC broke out again, with the trend appearing stronger as the Choppiness Index (CHOP) sits at 42 and declining, a signal of potential momentum.

Moreover, the Advance/Decline Ratio rose to 8, suggesting the price was moving up consistently. It has, however, started to decline as $XDC potentially forms a double top around $0.03700.
Mapping XDC’s breakout above KEY range – Can bulls hold above $0.037? image 4 $XDC/ $USDT

Overall, the price action had broken out of a bearish pattern on the bigger timeframes but was still stalling on the lower ones. It’s worth noting that these lower timeframes were showing a shift in momentum to the upside, suggesting the altcoin could escape the consolidation.

Final Summary

  • $XDC Network rallies 14% in a day after Animoca Brands partnership and network growth.
  • $XDC was bullish on bigger timeframe charts but slow on the smaller ones, though momentum was shifting.

0
0

Disclaimer: The content of this article solely reflects the author's opinion and does not represent the platform in any capacity. This article is not intended to serve as a reference for making investment decisions.

Understand the market, then trade.
Bitget offers one-stop trading for cryptocurrencies, stocks, and gold.
Trade now!

You may also like

BTIG warns: US stocks have entered "uncharted territory," and gold may further decline to $3,500

The low volatility in the US stock market is actually an illusion created by extreme divergence among sectors, with the internal structure being extremely fragile. BTIG warns that the market urgently needs a panic-induced sharp correction, with the Nasdaq facing at least an 8.5% pullback and the S&P 500 potentially dropping to 7,300 points. Additionally, the semiconductor sector has already broken technical support, the AI sector may be adversely affected by election policies, and both gold and silver have already peaked; the true market bottom is still far from being reached.

华尔街见闻•2026/11/02 07:36

Is there a "stealth bear market" in US stocks? AI stocks plunged 13% in October, and the "S&P 500 excluding AI" hit a new high

AI-related stocks have cumulatively declined by over 13%, while the S&P 500 index, excluding AI components, has risen by 8% and reached a record high. Some institutions refer to this as a "stealth bear market," suggesting that capital is shifting from high-valued AI stocks to non-AI component stocks. Despite intensified short-term volatility, these institutions remain optimistic about the medium- and long-term market outlook, believing that the current adjustment is fueling momentum for the next round of gains, and expect turbulence in the market in November.

华尔街见闻•2026/11/02 07:21
Is there a "stealth bear market" in US stocks? AI stocks plunged 13% in October, and the "S&P 500 excluding AI" hit a new high

FOMO Market: The Five Most Worth Buying U.S. Stocks Before the Midterm Elections

When market sentiment shifts, five stocks rated as "Strong Buy" by SA Quantitative Ratings may help investors maximize returns.

智通财经•2026/11/02 07:11