
A Chart Overview of Commodity Support and Resistance: Gold, Silver, Oil, Gas + Platinum, Palladium, Copper, and Agricultural Futures (May 22, 2026)

FX168 News on May 22—— An overview of commodity support and resistance in one chart: gold, silver, oil, gas + platinum, palladium, copper + agricultural product futures, updated on Friday, May 22, 2026 at 08:45 (UTC+8). Specifically covers 14 varieties including gold, silver, platinum, palladium, copper + crude oil, natural gas, fuel oil + wheat, corn, cotton. For more details, refer to the customized charts by FX168 Financial Analysis.
An overview of commodity support and resistance in one chart: gold, silver, oil, gas + platinum, palladium, copper + agricultural product futures, updated on Friday, May 22, 2026 at 08:45 (UTC+8). Specifically covers 14 varieties including gold, silver, platinum, palladium, copper + crude oil, natural gas, fuel oil + wheat, corn, cotton. For more details, refer to the customized charts by FX168 Financial Analysis.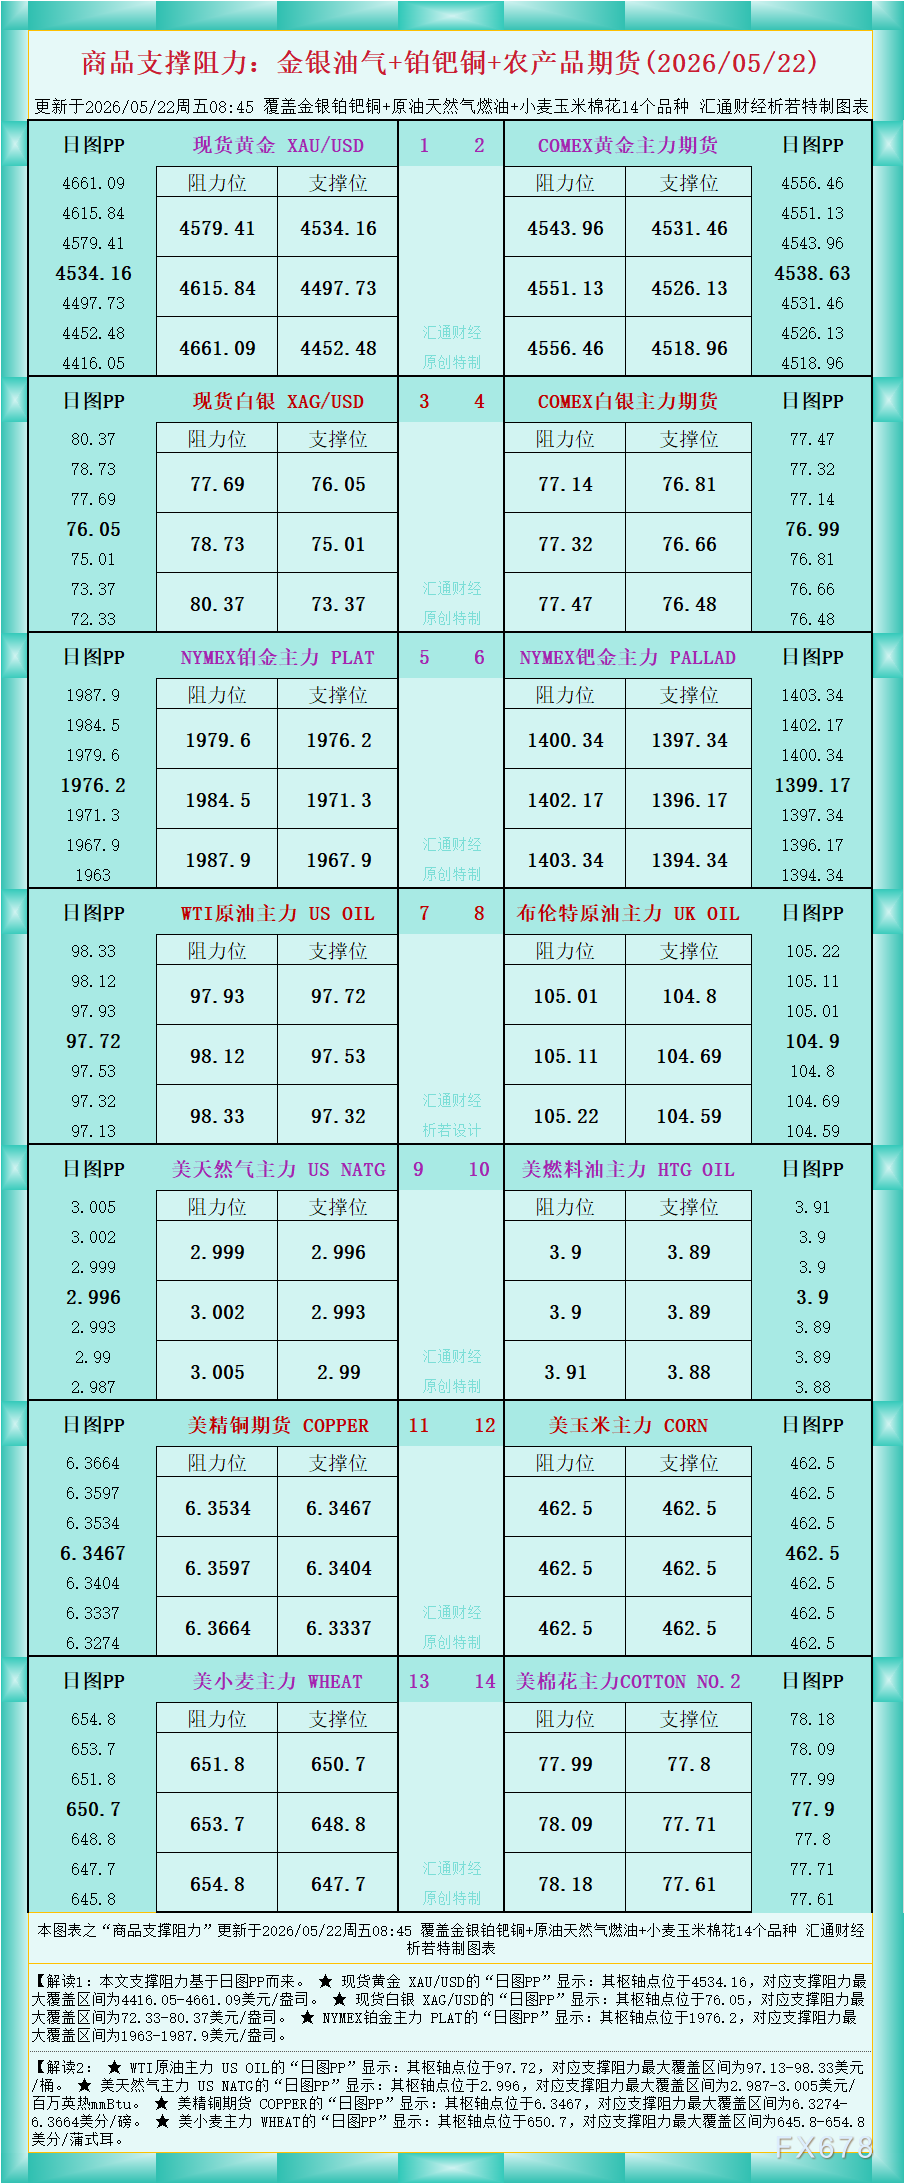
According to the data shown in the figure, Interpretation 1: The support and resistance in this article are based on daily chart PP (Pivot Point).
★ For spot gold XAU/USD, the “Daily Chart PP” shows a pivot point at 4534.16, with the maximum support and resistance range covering $4416.05–4661.09/oz.
★ For spot silver XAG/USD, the “Daily Chart PP” shows a pivot point at 76.05, with the maximum support and resistance range covering $72.33–80.37/oz.
★ For NYMEX platinum PLAT, the “Daily Chart PP” shows a pivot point at 1976.2, with the maximum support and resistance range covering $1963–1987.9/oz.
Interpretation 2:
★ For WTI crude oil US OIL, the “Daily Chart PP” shows a pivot point at 97.72, with the maximum support and resistance range covering $97.13–98.33/barrel.
★ For US natural gas US NATG, the “Daily Chart PP” shows a pivot point at 2.996, with the maximum support and resistance range covering $2.987–3.005/mmBtu.
★ For US copper futures COPPER, the “Daily Chart PP” shows a pivot point at 6.3467, with the maximum support and resistance range covering 6.3274–6.3664 cents/lb.
★ For US wheat WHEAT, the “Daily Chart PP” shows a pivot point at 650.7, with the maximum support and resistance range covering 645.8–654.8 cents/bushel.
For more variety interpretations, please refer to the chart. Original, customized by FX168 Financial, all rights reserved, for reference only.
Disclaimer: The content of this article solely reflects the author's opinion and does not represent the platform in any capacity. This article is not intended to serve as a reference for making investment decisions.
You may also like
One Macro Breakout Could Change the Altcoin Market: Are These 5 Cryptos Worth Holding Before the Next Rally?

Top 3 Cheapest Crypto Coins to Invest in — PEPE, VET, BONK

CyberLeek threatens full GTA 6 leak if Solana token hits $30 million

Micron now earns more than Apple! Apple urgently needs chips, Micron holds pricing power.
Micron Technology reported a net profit of $37.7 billion in the fourth fiscal quarter, surpassing Apple's $29.8 billion for the same period, thus becoming the more profitable company for the quarter. The memory shortage has given Micron strong pricing power, with its CEO stating that they “cannot meet customer demand.” The revenue guidance for next quarter is as high as $61.5 billion. Meanwhile, Apple's gross margin continues to be pressured by persistent memory costs, having dropped from 49.3% to a guidance range of 46.5%.
Crypto prices
More


