
Bitget App
Trade smarter
Buy cryptoMarketsTradeFuturesStocksEarnInstitutionAI & More
Why Bitcoin Cash traders can expect a relief rally after BCH’s 25% price bleed

Why Bitcoin Cash traders can expect a relief rally after BCH’s 25% price bleed

CryptoNewsNetCryptoNewsNet2026/05/22 03:33
By:CryptoNewsNet
Back to the list

Why Bitcoin Cash traders can expect a relief rally after BCH’s 25% price bleed

Why Bitcoin Cash traders can expect a relief rally after BCH’s 25% price bleed image 0  ambcrypto.com 3 m
Why Bitcoin Cash traders can expect a relief rally after BCH’s 25% price bleed image 1

Bitcoin Cash [$BCH] has been trading within a range for just over two years. Since April 2024, the once-prominent altcoin has been constrained to within the $272-$684 range.

This range is massive in both time and size, giving swing traders many more opportunities to enter the market with conviction than lower timeframe ranges might.

A month ago, AMBCrypto reported that $BCH was likely to continue its downtrend after revisiting the $480-$500 magnetic zone of short liquidations.

This expectation has come to pass. The $460 short-term support zone, once ceded to the sellers, quickly gave way to a 25.16% Bitcoin Cash drop from $465 (bearish retest) to $348.3.

Has the bearish impulse move ended, or should traders expect further losses?

Technical indicators suggest an overextended market
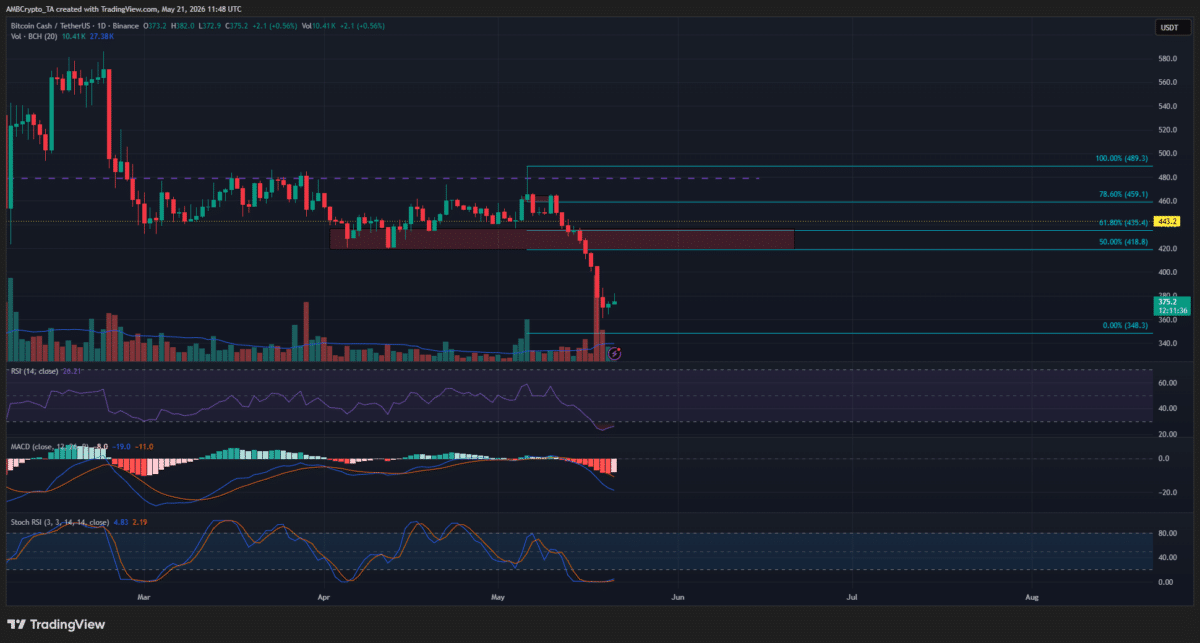
Why Bitcoin Cash traders can expect a relief rally after BCH’s 25% price bleed image 2 Source: $BCH/USDT on TradingView

The biggest sign that the impulse move downward might be over was the high-volume slide to $348, followed by a lower-timeframe bounce.

The large downward candlewick on Monday, the 18th of May, told a story of an overextended price move.

The RSI was at 26, within the oversold territory, while the Stochastic RSI appeared to form a bullish crossover. Together, they signaled a potential short-term bounce.

The Fibonacci retracement levels (cyan) were plotted using this impulse bearish move. A bounce to $418 is likely, though it can extend as high as $459 and the $489 swing high.

Therefore, traders can look to utilize a bounce to these levels to look for shorting opportunities. It must be noted that a retest of the key Fibonacci levels is not an automatic sell signal.

An internal structural shift on the lower timeframe price chart, such as the 1-hour, can be used to increase the odds of a successful trade.

It is also possible that $BCH bears will not allow a sizeable bounce. Depending on the wider market sentiment in the coming days, a bounce might struggle to clear the $400 area before falling to make new lows.

Traders should avoid FOMO and have clear rules to follow before entering. Rather than buying the bounce, swing traders might find a more feasible opportunity in selling the bounce.

Final Summary

  • The Bitcoin Cash rejection at $465 resulted in a 25% price slide that reached a swing low of $348.
  • The current bounce is just a relief rally, and the trend continues to favor the sellers.
0
0

Disclaimer: The content of this article solely reflects the author's opinion and does not represent the platform in any capacity. This article is not intended to serve as a reference for making investment decisions.

Understand the market, then trade.
Bitget offers one-stop trading for cryptocurrencies, stocks, and gold.
Trade now!

You may also like

Vertiv, the leader in AI liquid cooling, reports Q3 revenue up 61% year-on-year, orders increase over 100%, pre-market surge over 15% | Financial Report Insights

Vertiv's net sales for the third quarter reached $4.313 billion, up 61% year-on-year, with adjusted earnings per share at $2.21, up 78% year-on-year, both far exceeding expectations. Organic orders grew over 100% year-on-year, indicating strong momentum is likely to continue. The company has comprehensively raised its full-year guidance, with a midpoint net sales target of $14.65 billion and midpoint earnings per share of $7.15. Premarket share price surged over 15% at one point.

华尔街见闻•2026/10/28 12:27

The most reliable warning signal in the US stock market has lit up! After flashing twice in history, both times were followed by a major bear market

The quality factor QMJ, which has tracked the US stock market for nearly 70 years, is issuing a rare warning. In July this year, the indicator posted its largest single-month gain of 14.3% since 1957, as the long-running outperformance of junk stocks over more than two years was suddenly reversed. Historically, similar sharp reversals in QMJ occurred during the bursting of the internet bubble in 2000 and the financial crisis in 2008.

华尔街见闻•2026/10/28 10:32
The most reliable warning signal in the US stock market has lit up! After flashing twice in history, both times were followed by a major bear market

Tonight, the Federal Reserve's "no action" is unsurprising, and the market chooses to "buy everything" (except crude oil).

The Federal Reserve is almost certain to pause rate hikes tonight, but strong U.S. economic data is pushing the probability of a rate hike in December back above 80%, fueling expectations for “higher rates for longer.” Strangely, stocks, the dollar, gold, and bitcoin are all rising simultaneously, with the market staging a “buy everything” rally, while only crude oil is falling against the trend. Behind this broad rally, AI financing pressures and credit risks persist, and Wall Street is warning of market correction risks.

华尔街见闻•2026/10/28 10:25