
Which assets will benefit from the El Niño phenomenon?

Weather variables in 2026 are no longer just meteorological headlines. The National Climate Center’s April monitoring predicted that El Niño conditions would develop by May 2026, resulting in a moderate or stronger El Niño event over the summer and autumn, lasting at least until the end of the year. The NOAA forecast in May gave an even higher probability: more than an 82% chance of El Niño forming between May and July 2026, a 96% probability of it persisting through the Northern Hemisphere winter, and over a 30% chance of turning into a super El Niño by November.
According to a report by Guosheng Securities analysts Xu Wenhui and others on May 20, “The El Niño event in 2026 will cause climate disruptions to major agricultural regions producing sugar, palm oil, rubber, and cotton, possibly leading to lower yields and higher prices for these crops.” This same chain of climate effects will also impact China’s summer electricity usage: drought in the north, flooding in the south, and rising temperatures may boost thermal power generation and demand for steaming coal.
But what’s most noteworthy is that it’s not as simple as “El Niño comes, commodities rise.” Sugar also overlaps with its own roughly six-year price cycle and shows signs of bottoming in 2026; palm oil and natural rubber prices usually do not immediately peak but hit highs four to five quarters after the ONI index peaks; cotton is even more constrained by demand and inventory, exemplified by its price peak arriving before the ONI index in 2023-2024.
Therefore, historically observed maximum price increases can’t simply be projected onto 2026 returns. The real focus should be on three things: whether adverse weather in primary production zones leads to real output declines, if these declines start to affect inventory and trade, and if price reactions lag before materializing.
The probability of this El Niño is not low—and intensity risks remain
The definition of El Niño isn’t complicated: when the NINO3.4 index’s three-month running average reaches or exceeds an absolute value of 0.5°C for at least five months, it qualifies as an El Niño event. By peak intensity: 0.5°C to just below 1.3°C is weak, 1.3°C to just below 2.0°C is moderate, 2.0°C to just below 2.5°C is strong, and 2.5°C and above is super.
After 1980, there have been 13 El Niño events, including six moderate and three super events. Of the nine events categorized as moderate or above, their durations ranged between 7 and 19 months, almost all peaking during the Northern Hemisphere winter.
The climate impacts are also fairly clear: Southeast Asia and Australia tend to experience high temperatures and drought, with increased forest fire risk; China faces likely drought in the north and flooding in the south; South and North America’s south are prone to heavy rainfall and flooding; North America’s central and eastern regions are prone to heatwaves.
This explains why agricultural products, thermal power, and coal all warrant close attention. The first group is susceptible to supply disruptions, the latter two depend on summer electricity demand.
Sugar isn’t just about the weather—it sits atop a six-year cycle
Sugar is the most unique asset in this review. Global sugar production is mainly concentrated in Brazil, India, the EU, Thailand, and China—together accounting for roughly 60% of world output. Its price distinctly exhibits a complete six-year cyclical feature.
In the last three cycles:
-
After bottoming in 2008, sugar prices rose to 2011, then fell to 2014;
-
After bottoming in 2014, prices climbed until 2017, then corrected down to 2020;
-
After bottoming in 2020, prices rose to 2023, then entered a decline with indications of bottoming out again in 2026.
Historically, El Niño and the sugar price upcycle often overlapped. From 2009 to 2011, sugar’s maximum increase was around 78%; from 2014 to 2016, about 55%; from 2020 to 2023, about 39%.
The supply-side disruptions behind these moves were tangible. In 2009-2010, Brazil’s cane crushing season was marked by excessive humidity, while India’s cane yield dropped due to less rainfall, with sugar output falling year-on-year by 24% in the 2008/09 season and further down to 18–18.5 million tons in 2009/10; rainfall declined in central Thailand, and chronic drought occurred in Guangxi, China’s primary cane region.
From 2014 to 2016, Brazil’s peak harvest season was impacted by increased rainfall, affecting crushing and sugar yields; India’s main cane regions suffered from high temperatures and drought, cutting 2015/16 output by 9.18% year-on-year to a seven-year low, shifting India from net exporter to net importer; Thailand’s sugar production dropped by 13% year-on-year.
But 2023-2024 gave a counter-example: Brazil’s abundant rainfall led to a massive output increase, offsetting shortages in other regions, and sugar prices peaked ahead of the ONI index. This demonstrates that sugar’s price is highly elastic but increasingly depends on output offset dynamics among top producers.
Palm oil and natural rubber show more lagged effects
Palm oil production is highly concentrated, with Malaysia and Indonesia together responsible for about 80% of global supply. In historical samples, palm oil prices usually peak around four quarters after the ONI index peaks.
In three El Niño events, maximum palm oil futures price increases were:
-
2009–2010: about 71%;
-
2014–2016: about 48%;
-
2023–2024: about 45%.
In 2009, Southeast Asia’s rainfall plummeted, prompting Indonesia’s 2010 palm oil output to be revised down from an expected 24.5 million tons to 21.96 million, and Malaysia’s from 20.5 million to 16.99 million—triggering a strong price response.
During 2014–2016, even though it was a super El Niño, palm oil prices were less elastic than the previous round due to a global glut in soybean oil, declining imports in major demand centers like the EU, India, and China, and ample inventories. The same happened in 2023: Malaysia’s palm oil output did not decline but increased, inventories grew, monthly rainfall was not markedly below normal, and weather impacts were not fully priced in.
Natural rubber’s El Niño signals are even stronger, and the lag is more obvious. In the last five events, rubber prices generally peaked four to five quarters after the ONI index.
The five event maximum gains were:
-
1997–1998: about 33%;
-
2002–2003: about 118%;
-
2009–2010: about 167%;
-
2014–2016: about 101%;
-
2023–2024: about 54%.
Natural rubber production is concentrated in the Asia-Pacific, inherently vulnerable to Southeast Asia’s droughts. In 2002–2003, persistent drought hindered rubber tree growth and latex flow, and with global economic growth and over-sold forward orders, prices soared. In 2009, ANRPC member countries’ rubber output was 8.917 million tons, a 3.5% decline year-on-year. In 2016, ANRPC output was 10.77 million tons, down 2.5% year-on-year.
In the 2023-2024 period, El Niño, aging rubber trees, and a shortage of tappers jointly affected supply; in 2024, both domestic and overseas producing areas faced high temperature and drought, and tapping was delayed. On the demand side, downstream tire companies saw stable demand, with strong semi-steel tire exports, magnifying the price elasticity from both supply and demand.
Cotton’s challenge: favorable weather influences may be suppressed by weak demand
Cotton is also affected by El Niño, but the price path is more complex. Major producing regions include Asia-Pacific, North America, Latin America, and Africa, spanning China, India, Pakistan, Australia, the US, Brazil, and more.
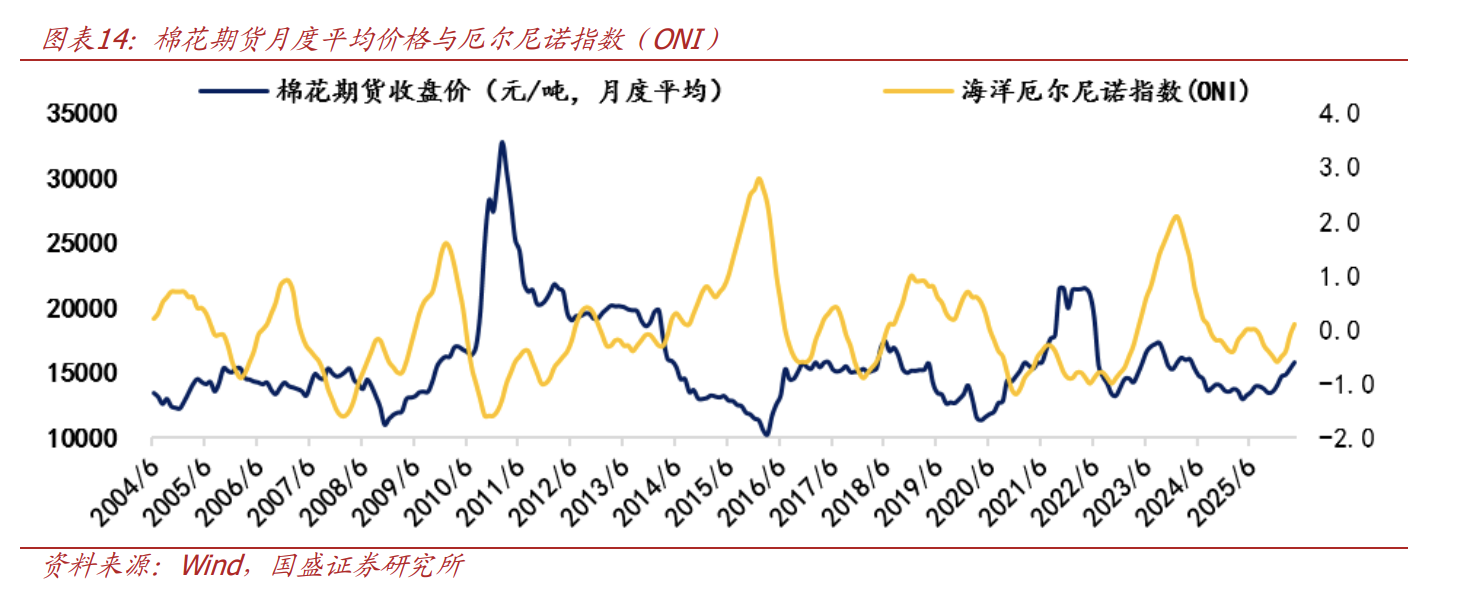
During three historical events, the largest cotton futures price gains were:
-
2009–2010: about 149%;
-
2014–2016: about 54%;
-
2023–2024: about 30.7%.
The 2009–2010 surge was a supply-demand resonance. Less rainfall in the western Pacific and severe drought in South Asia, Southeast Asia, and Australia affected cotton planting; India imposed a cotton export ban; China’s textile and apparel industry bottomed and rebounded. At the time, global cotton consumption exceeded output by 15%, inventories dropped rapidly, and price elasticity was amplified.
In 2014–2016, inventory pressure came first. By the 2014/15 season, global ending stocks reached 23.531 million tons, growing for five consecutive years and hitting the highest since 1960. Subsequently, insufficient demand led to reduced output, with shrinking planting area in the US, Australia, and China; meanwhile, El Niño hit Xinjiang, India, and Australia, and after a bottom in March 2016, cotton prices rose steadily.
2023–2024 was another warning. Demand was weak, increased supply came from state cotton auctions and new import quota releases, and high cotton yarn inventories depressed spinning rates; on supply, despite prolonged drought in the US, Brazil had a bumper crop, offsetting some US risk. Ultimately, cotton prices peaked prior to the ONI index.
This means that whether cotton will see strong price elasticity in 2026 depends not only on weather, but also on demand and inventory alignment.
Thermal power and steaming coal watch the summer window
Agricultural commodities depend on reduced output, while thermal power and steaming coal depend on electricity use.
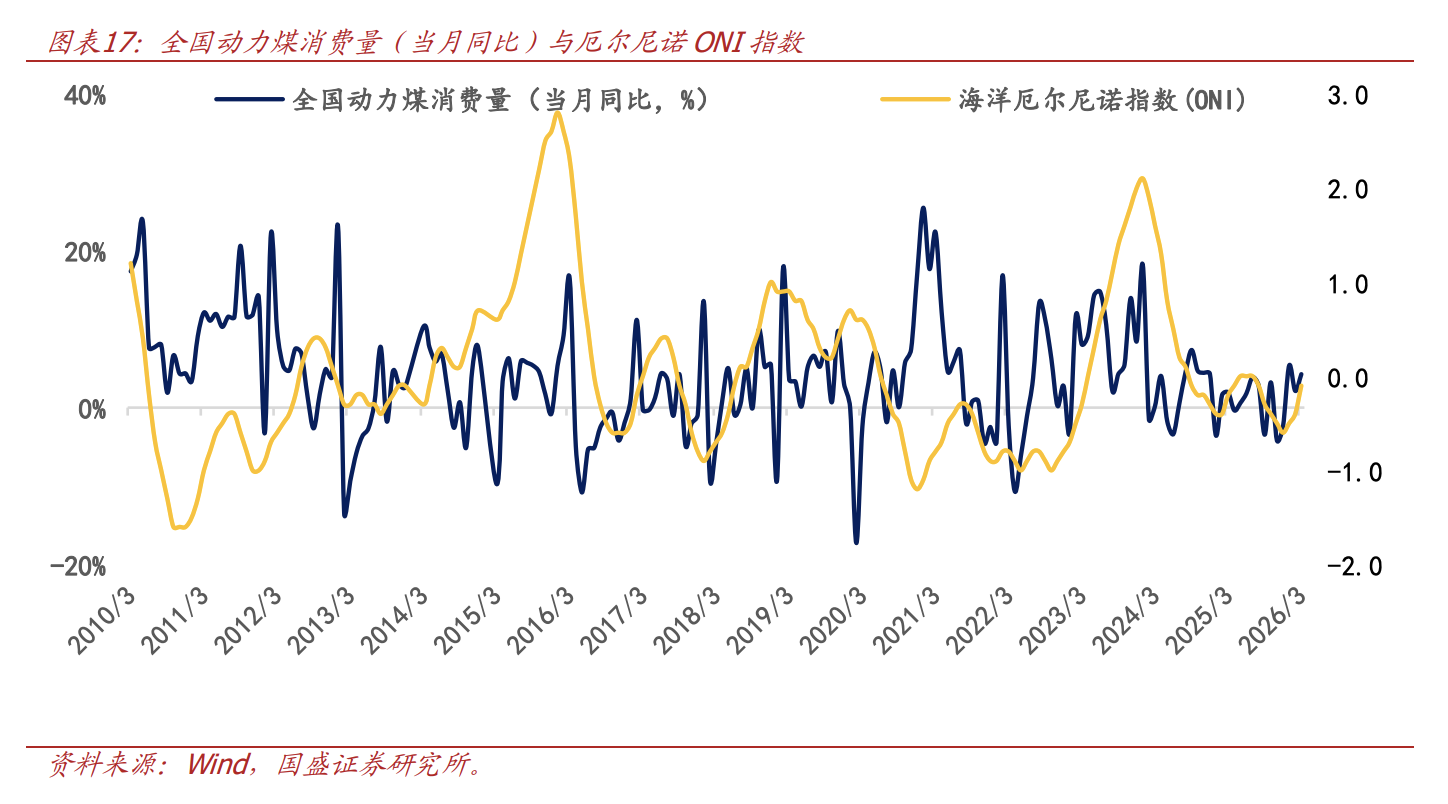
During the 2009-2010, 2014-2016, and 2023-2024 El Niño events, as the ONI index surged to its peak (usually June to August), national thermal power generation and steaming coal demand rose year-on-year.
The logic is simple: El Niño drives up global temperatures, causing China’s summers to experience drought in the north and flooding in the south, and average temperatures rise rapidly, increasing power consumption; outside of hydropower, thermal power and steaming coal usage increase accordingly.
Thus, coal and power aren’t an extension of the agricultural output reduction narrative, but another chain of weather transmission: heat—electricity demand—thermal power—steaming coal.
In trading, El Niño isn’t the point—materialized output reduction is
The historical review provides a clear watchlist: sugar, palm oil, natural rubber, cotton, as well as coal, power-related companies, and industry ETFs—all are tracks to follow under the 2026 El Niño scenario.
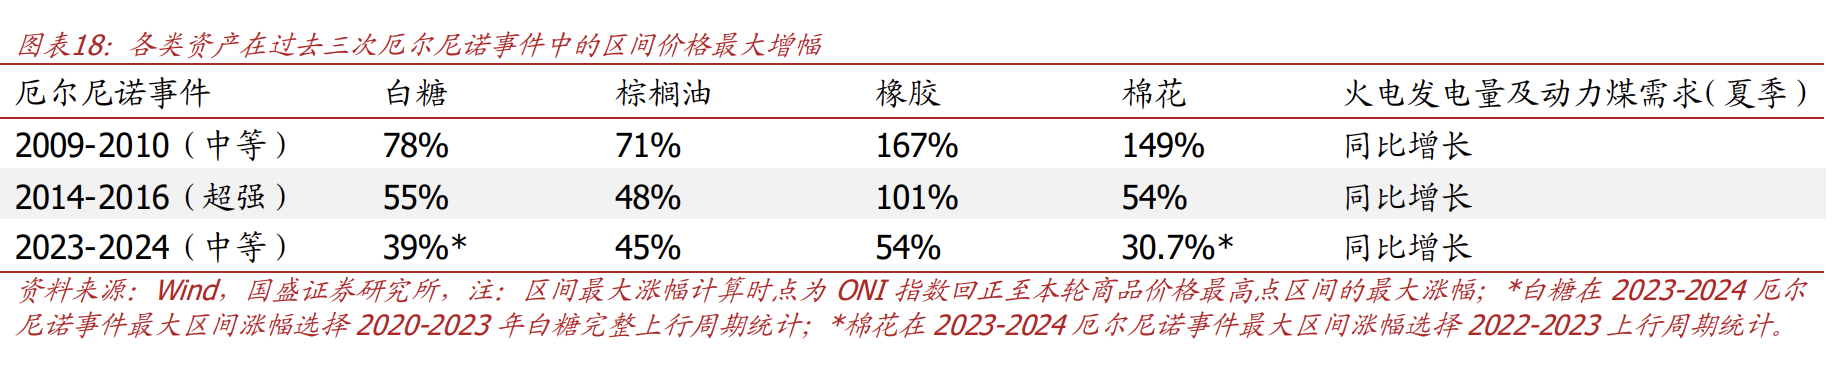
But avoid treating “El Niño” as a one-button for price surges. 2023–2024 already proved that with a similar moderate El Niño, both sugar and cotton prices could peak before the ONI index; palm oil might also react only mildly if rainfall is not significantly below normal and inventories build up.
The more practical tracking order: First watch for abnormal weather in main producing regions; next see if production forecasts are revised down; then monitor inventory and trade flow changes; finally, check whether prices are entering a lagged upward phase.
Risks are also significant. Meteorological changes will disrupt supply, changes in US dollar liquidity will affect broad asset performance; more importantly, historical estimates are based on past samples: if market structure changes dramatically, so too will asset performance.
Disclaimer: The content of this article solely reflects the author's opinion and does not represent the platform in any capacity. This article is not intended to serve as a reference for making investment decisions.
You may also like
Gold price holds critical $4,100 support, but can it break $4,200 as inflation risks loom?
Hinkal joins Mastercard Crypto Partner Program for private stablecoin payments
Chipmaker earnings growth cools to 136% as AI boom lifts S&P 500
Updated: Delta Air Lines warns that as fuel prices hit profits, airline capacity will tighten further
Delta Airlines lowers its annual profit forecast due to an expected increase in fuel costs to $6 billion. The CEO stated that ticket prices have risen by about 20% this year, with limited passenger resistance. Analysts warn that maintaining high ticket prices in 2027 is critical for improving profitability. The article includes comments from the earnings call and analyst remarks. Rajesh Kumar Singh/Shivansh Tiwary, Reuters Chicago, October 9 - Delta Airlines (DAL.N) said on Friday that, despite strong travel demand and rising ticket prices, soaring fuel costs have forced it to cut its 2026 profit expectations by nearly a quarter. So, the airline industry may need to further limit flight growth next year to protect profitability. This warning highlights the increasingly tough challenges faced by U.S. airlines. While strong demand and restricted seat growth have allowed airlines to significantly raise ticket prices and offset higher fuel costs, aggressively increasing flights to capture more demand may intensify competition, making it harder to maintain high fares and protect profits. Based in Atlanta, Delta now expects its annual fuel expenditure to increase by about $6 billion compared to last year—about $2 billion higher than its July forecast—due to the Iran war (link) causing global jet fuel prices to spike. Airlines worldwide are preparing for a prolonged fuel shock. Michael O’Leary, CEO of Ryanair Group RYA.I, said Thursday that high jet fuel prices could persist for another 12-18 months (link), adding more pressure on airlines to raise fares and control costs. https://www.reuters.com/graphics/AUTOMATED-20261008/A4A-JET-FUEL-DAILY-1Y/xmpjwjnmbvr/chart.png “In a high-cost environment, you can’t simply grow your way out,” Delta CEO Ed Bastian said on the earnings call. He noted that the industry has already taken steps to restrict capacity, but more measures will be needed next year to improve profitability. Bastian said Delta raised ticket prices about 20% this year, and passenger resistance has been limited. He is confident that even if fuel costs eventually drop, the high fares can still be maintained. Delta lowered its adjusted annual earnings per share forecast from the July prediction of $6.50-$7.50 to $5.10-$5.60. According to LSEG data, the midpoint of the new range is below analysts’ average expectation of $5.46. Third-quarter adjusted earnings per share were $1.72, four cents below analysts’ average forecast. In midday trading, shares of Delta dropped 1.7%, United Airlines UAL.O fell 1.4%, and both American Airlines AAL.O and Southwest Airlines LUV.N were down about 1%. Delta partly shields itself from rising fuel costs by owning a refinery outside Philadelphia (link), which is expected to generate over $700 million in profits this year. Even with this buffer, the airline expects its fourth-quarter fuel price to rise from $3.61 per gallon in Q3 to $4.25 per gallon. Delta forecasts adjusted fourth-quarter earnings per share to be between $1.15-$1.65, with the $1.40 midpoint roughly matching analysts’ average expectation of $1.39. Fare increases Government data shows that in the first eight months of 2026, U.S. airlines spent $42.9 billion on fuel, an increase of $13.2 billion compared to the same period last year despite slightly reduced consumption. According to the U.S. Bureau of Labor Statistics, strong demand and limited seat growth pushed average U.S. airline ticket prices up by about 25% year-on-year between April and August. https://www.reuters.com/graphics/USA-AIRLINES/FUEL/lbpgdnbzwvq/chart.png Analysts at Melius Research said that despite surging fuel costs, Delta’s ability to raise fares helps keep second-half profits roughly stable. Still, they warn that the company’s profit margin has struggled to improve over the years. “It is critical for margin improvement to maintain or raise fares in 2027,” they wrote in their research report. With industry capacity growth expected to accelerate in Q4, this challenge will likely become even tougher. Deutsche Bank analysts expect the proportion of fuel costs recouped through revenue measures to fall in Q4 and predict full recovery won’t happen until early 2027. Bastian noted that low industry returns are another reason for limiting capacity growth. He said Delta will be cautious with its 2027 capacity plan until the fuel price outlook becomes clearer. He added that international routes may account for a larger share of Delta’s capacity expansion compared to domestic routes. Currently, Delta says its premium cabins and corporate travel business remain strong, and its economy cabin business is gradually improving. With Q4 ticket bookings already exceeding 60%, Delta expects revenue to increase about 20% year-on-year, despite limited capacity growth. Executives said early booking trends for Q1 2027 are also encouraging. (For the convenience of non-native English speakers, Reuters automatically translates its reports into several
Crypto prices
More


