
Unusual Options Activity: DVN, ESI and Others Attract Market Bets, DVN V/OI Ratio Reaches 1071.4

EST May 27th Morning Delivery - In the last two hours of trading, 10 options with a high V/OI ratio were detected. With the market volatile, it's crucial to stay informed on the latest options trends.
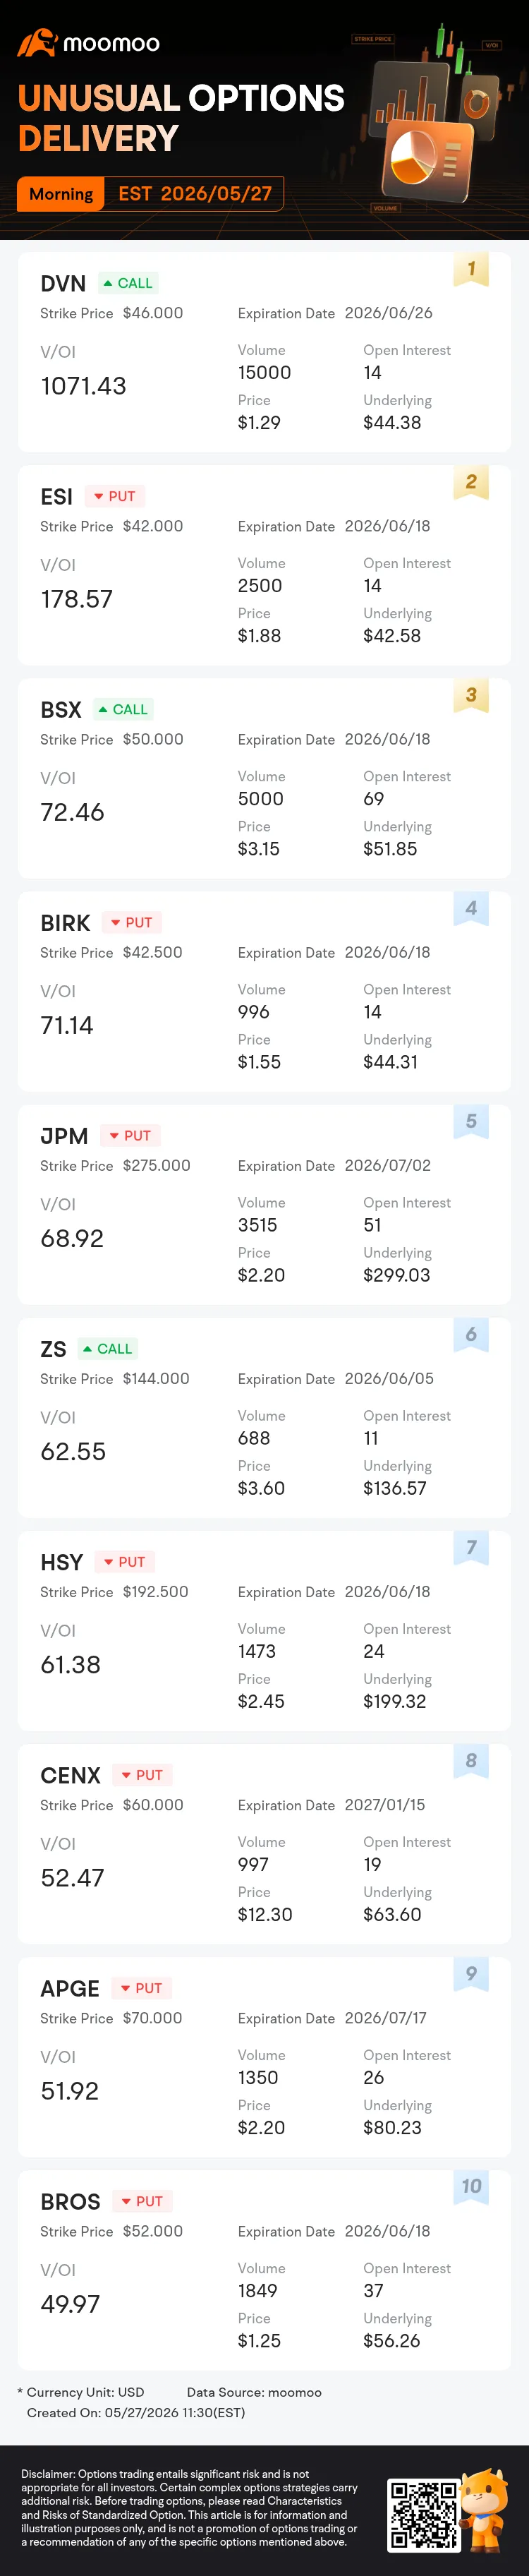
Of the 10 options trades detected with a high V/OI ratio, a trade on $Devon Energy (DVN.US)$ call contracts stood out with a volume of 15,000, far exceeding its open interest of 14 with a V/OI ratio of 1071.43. The premium, or cost, of the trade was $1.94 million. The strike price of this contract is $46.000 and the expiration date is June 26th, 2026, 30 days later.
Another option trade worth noting is a trade on $Element Solutions (ESI.US)$ put contracts with a volume of 2,500, far exceeding its open interest of 14 with a V/OI ratio of 178.57. The premium, or cost, of the trade was $470K. The strike price of this contract is $42.000 and the expiration date is June 18th, 2026, 22 days later.
There is also a notable transaction on $Boston Scientific (BSX.US)$ call contracts with a volume of 5,000, far exceeding its open interest of 69 with a V/OI ratio of 72.46. The premium, or cost, of the trade was $1.58 million. The strike price of this contract is $50.000 and the expiration date is June 18th, 2026, 22 days later.
See below for more unusual options activities.
Notes:
Unusual options activity identifies a single option trade with a volume-to-open-interest ratio (V/OI) equal to or above 10, which means the volume of the trade is much higher than the existing positions. High V/OI often implies that a trader is opening a new position with an unusual amount. Options activities are filtered based on the following criteria:
Options trade with V/OI≥10, while OI of the contract must be ≥10.
Options trade with premium≥$50,000.
The underlying asset of selected options must be individual stock with a market cap≥$5 billion.
If there are at least 3 or more trades that meet all the criteria in the corresponding time period, an article will be generated at 11:30, 13:30, and 16:30 ET each trading day.
Disclaimer: The content of this article solely reflects the author's opinion and does not represent the platform in any capacity. This article is not intended to serve as a reference for making investment decisions.
You may also like
NEWMARK GROUP INC <NMRK.O>: KBW CUTS TARGET PRICE TO $16 FROM $17.50
NEWMARK GROUP INC : KBW CUTS TARGET PRICE TO $16 FROM $17.50
VALERO ENERGY CORP <VLO.N>: JEFFERIES CUTS TARGET PRICE TO $394 FROM $401
VALERO ENERGY CORP : JEFFERIES CUTS TARGET PRICE TO $394 FROM $401
Gold prices rise Rs 1,500/10g; silver up Rs 3,100/kg ahead of US economic data, softer yields. Buy, sell or hold?
The Shopify Stock Rally Isn't Done: Chart of the Week -- Barrons.com
By Doug Busch Shopify is no longer a pandemic-era growth story that simply failed to slow down. It is compounding at a pace few software platforms its size still manage. In the second quarter of 2026, sales on its platform rose 32%. That was the fifth straight quarter of growth exceeding 30%. Merchants are also using more of Shopify's own tools, from payments to Shop Pay, and new channels like AI shopping agents are starting to increase demand. The simple bull case is that the stock already commands a huge share of independent online commerce, and that position should become more valuable as more buying moves through its checkout. A rule of market mechanics is that the vast majority of an individual security's gain is driven by its underlying sector. Within technology, software has staged a robust recovery, joining semiconductors to power the broader sector higher. The iShares Expanded Tech-Software Sector ETF has maintained an upward trajectory since its mid-April lows, though the advance from $74 to $112 has been choppy as bulls repeatedly stepped in to defend when necessary. Breadth across large-cap software has expanded significantly, with 24 constituents surging over 20% over the past three months. During that same three-month window, Shopify generated outstanding relative strength, advancing 36%, more than doubling the IGV's 17% gain over the same period. Expect the stock's outperformance to persist as software momentum broadens. Let's examine the daily and monthly charts to outline the technical drivers behind this thesis. Looking at the daily chart, the ratio chart against the IGV shows persistent outperformance extending back to mid-May. The stock is riding an eight-session winning streak, during which price action cleared a double-bottom-with-handle pivot at $151.39. Within this broader base, the stock recorded a bullish golden cross in late August and successfully filled its Sept. 10 price gap, tracing back to its Aug. 4 session, the day before a powerful earnings reaction sent the stock surging 17% hi
Crypto prices
More


