

Injective trades at $6.206 on May 29, breaking above every daily EMA in a single session after confirming native USDC is now live on the network, opening access to Circle’s regulated stablecoin liquidity for tokenized stocks and pre-IPO assets.
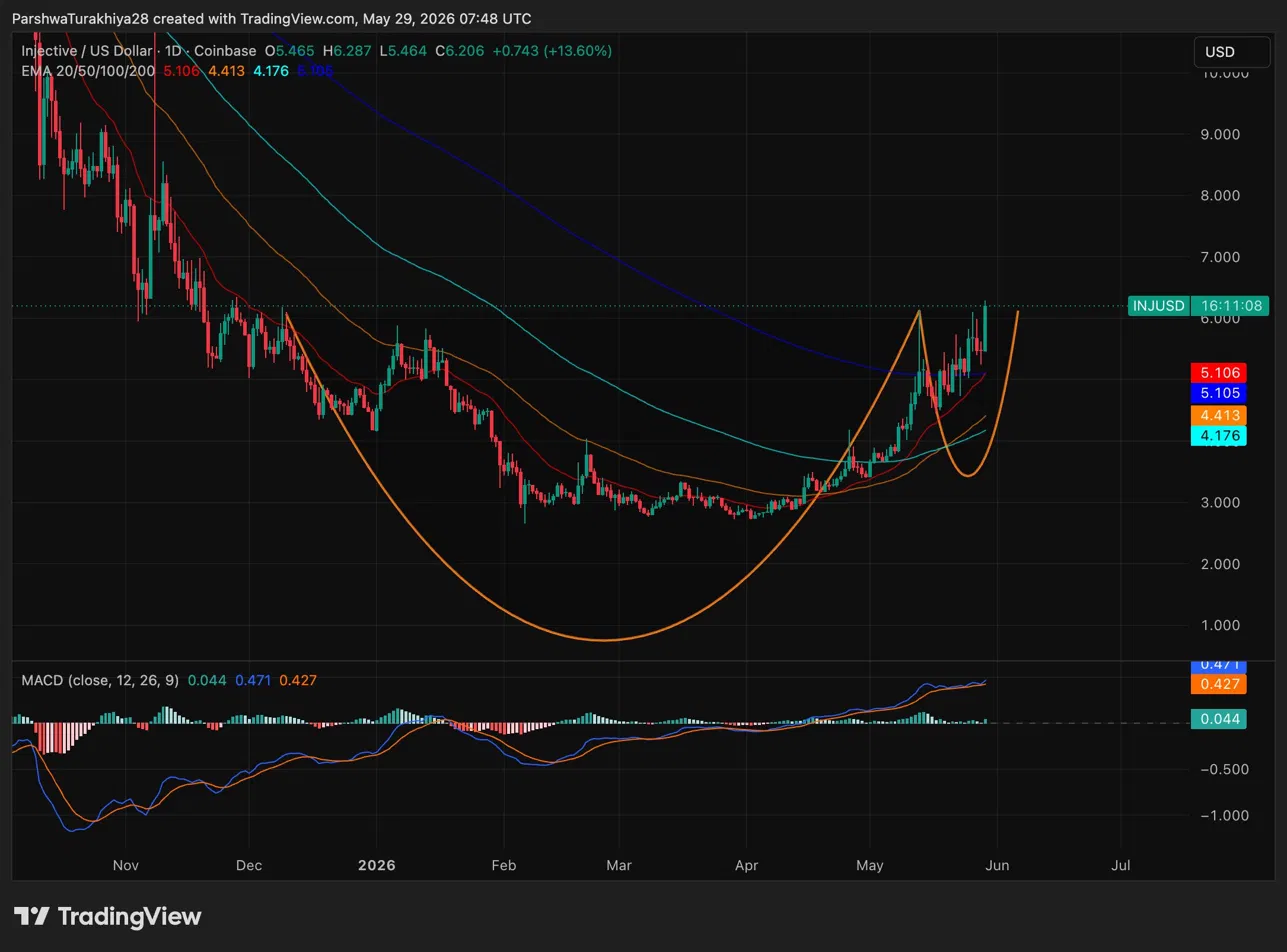 INJ/USD Daily Price Action (Source: TradingView)
The daily chart has been building a textbook cup and handle formation since the December lows. The cup bottomed near $1.50 in early February and curved back up through March and April, with the handle consolidating between $3.50 and $5.00 through May. Today’s candle broke above the handle’s upper boundary and cleared all four EMAs simultaneously, the 20 EMA at $5.106, the 50 EMA at $4.413, the 100 EMA at $4.176, and the 200 EMA at $5.705.
The MACD has been in a sustained bullish cross for weeks, with the MACD line at 0.471 and the signal at 0.427, both well above zero and continuing to expand. The histogram is green and widening, confirming momentum is accelerating rather than fading. The prior resistance zone near $6.00 to $6.30 is the immediate test. Above that, the dotted horizontal level near $6.50 aligns with prior structure from November 2025 and is the next meaningful ceiling.
INJ Key levels for May 30:
- Resistance: $6.287 (today’s high), $6.50 (November structure), $8.00 (100 EMA on weekly)
- Support: $5.705 (200 EMA), $5.106 (20 EMA), $4.413 (50 EMA)
Injective confirmed native USDC is live on the network, giving it direct access to Circle’s regulated stablecoin ecosystem currently valued at over $77 billion. The integration is not just a liquidity upgrade. It enables tokenized stocks, pre-IPO assets including SpaceX, and DeFi applications inside Injective to settle in a compliant, regulated dollar instrument rather than bridged or synthetic alternatives.
The timing matters. Real-world asset tokenization is one of the fastest-growing narratives in crypto right now, with DTCC, BlackRock, and Nasdaq all moving toward blockchain-based securities infrastructure. Injective is now positioned to capture that flow with compliant stablecoin rails already in place. Networks that support regulated liquidity at this stage tend to attract institutional developer activity ahead of the broader market catching up.
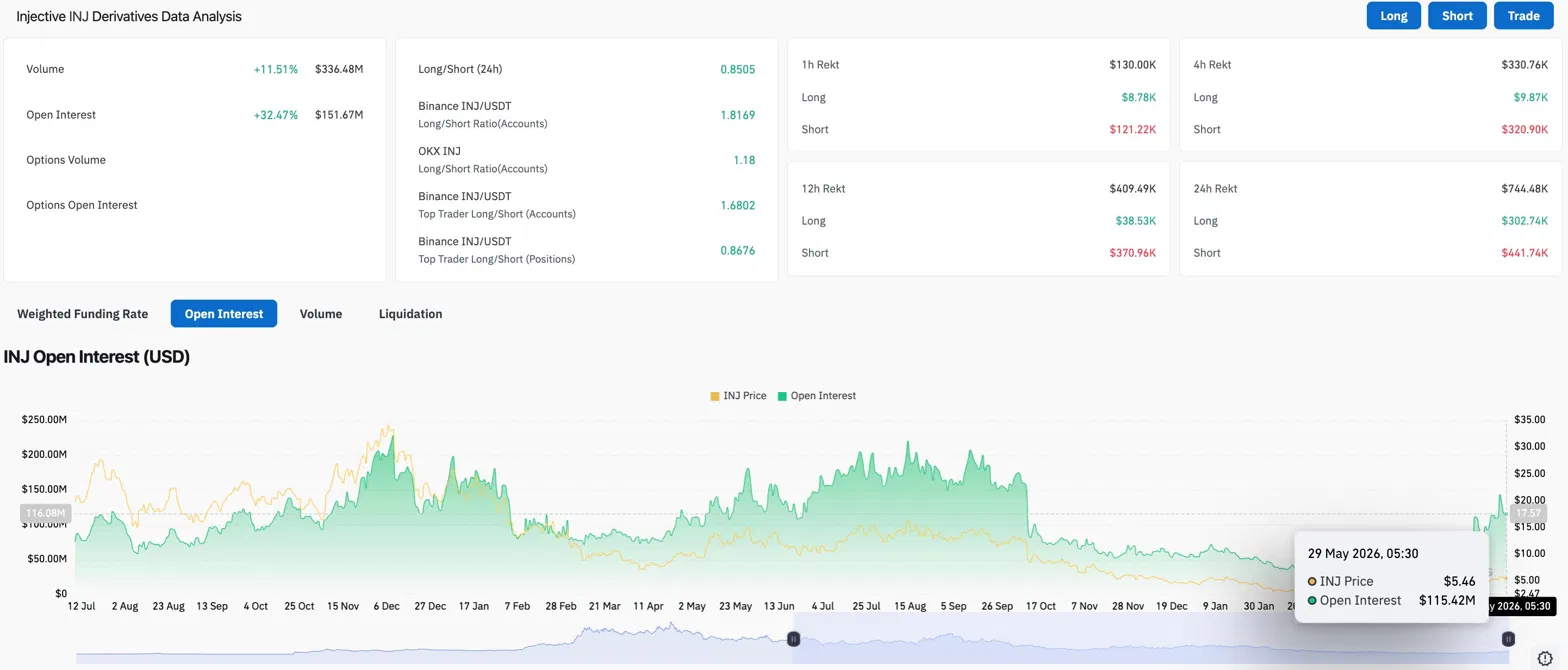 INJ Derivatives Analysis (Source: Coinglass)
Open interest surged 32.47% to $151.67M while volume climbed 11.51% to $336.48M. OI rising faster than volume points to fresh positions being built rather than short-term speculation driving the move. Shorts absorbed $441.74K in liquidations over 24 hours against $302.74K for longs, bears are on the wrong side of this move.
The retail long/short ratio sits at 0.8505, meaning more retail accounts are short. Top traders on Binance run a 1.6802 long/short ratio by accounts but only 0.8676 by positions, suggesting professionals are cautious about sizing despite being directionally long. That gap between account ratio and position ratio is worth watching as price approaches the $6.50 resistance zone.
INJ Price Prediction for May 30
- Upside: Holding above the 200 EMA at $5.705 on any pullback keeps the breakout valid, with $6.50 as the next target and $8.00 as the broader objective if momentum sustains.
- Downside: Losing $5.705 on a daily close pulls INJ back into the handle range, with the 20 EMA at $5.106 as the next demand level.


