
Bitcoin plums new six-week lows as analyst eyes BTC price dip 'end' at $72K

Bitcoin (BTC) deepened six-week lows at Friday’s Wall Street open as US stock markets diverged to all-time highs.
Key points:
- Bitcoin sinks closer to $72,000 as analysis eyes "crucial" BTC price levels.
- US-Iran ceasefire talks send stocks to even higher records as the crypto divergence continues.
- Bitcoin's 100-day moving average gains significance as a battleground for bulls.
BTC price analysis sees "crucial" range now in play
Data from TradingView showed BTC/USD dropping to $72,395 on Bitstamp to start the US TradFi trading session.
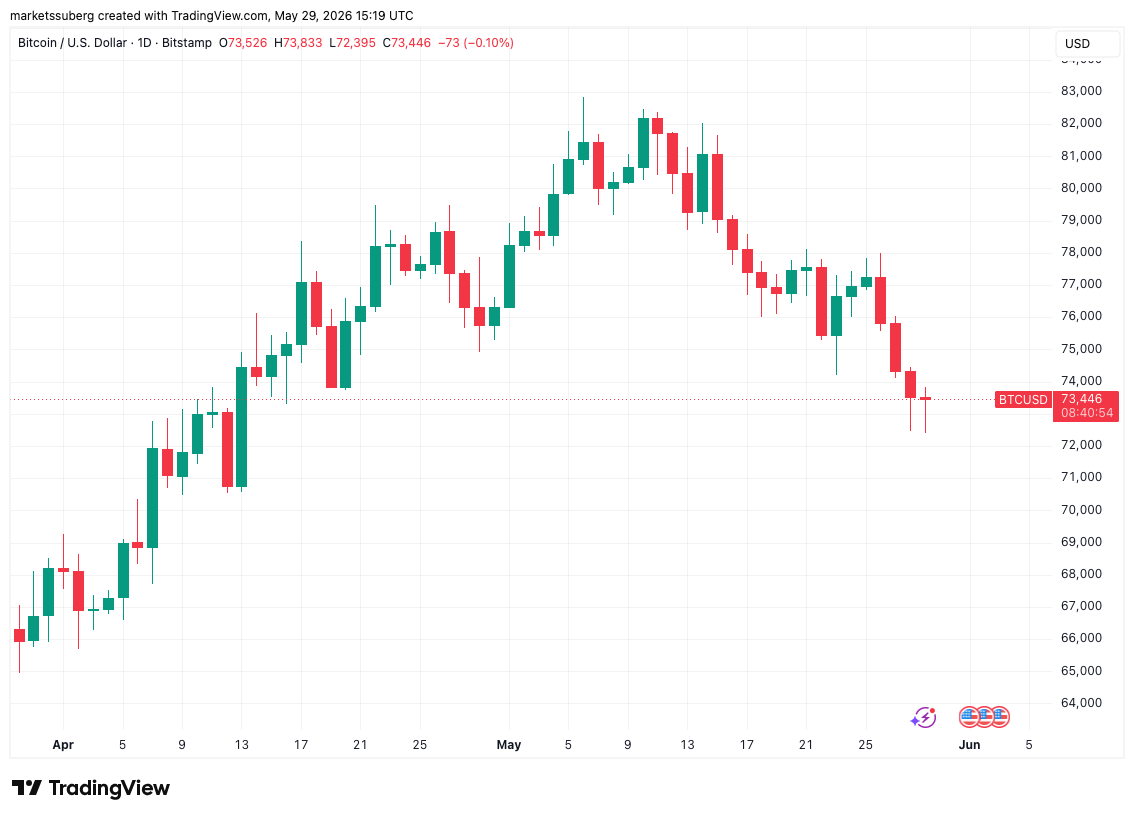
BTC/USD one-day chart. Source: Cointelegraph/TradingView
Continuing a losing streak from recent weeks, the pair again saw downside pressure, even as stocks surged further into price discovery.
The S&P 500 started Friday with new record highs, while the Dow Jones Industrial Average did likewise.
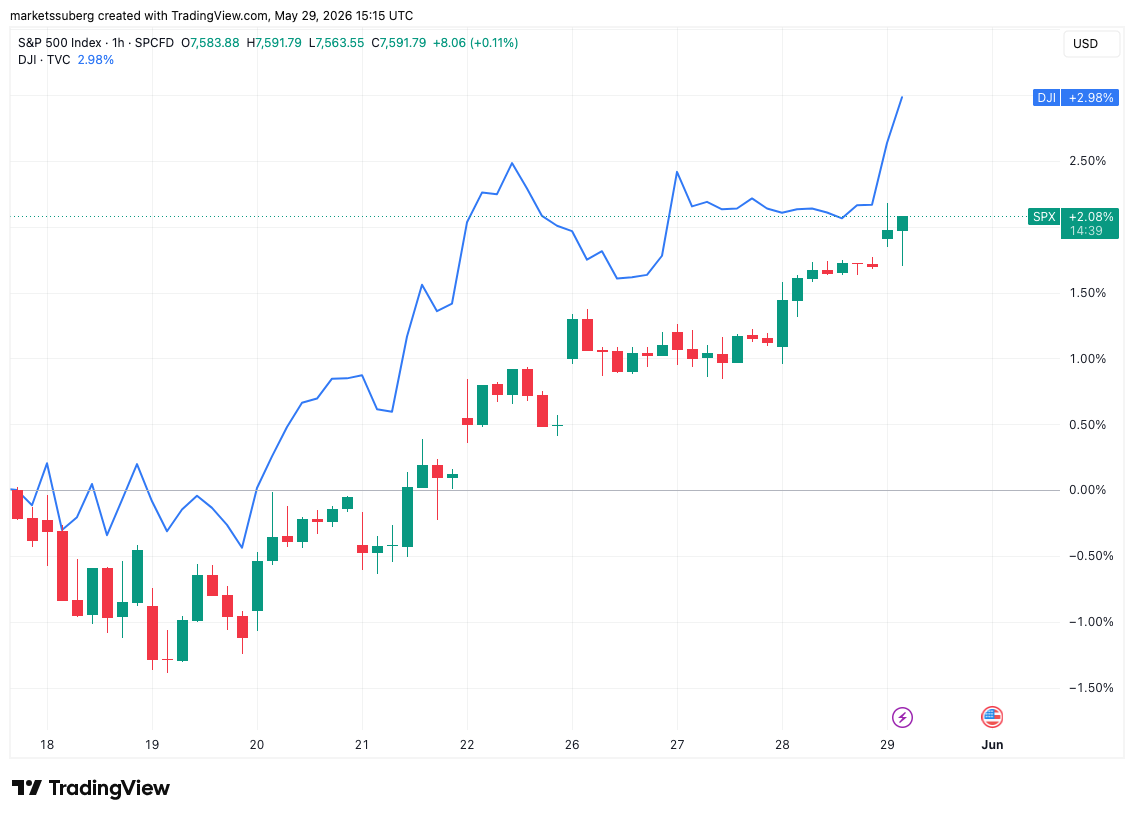
S&P 500 vs. Dow Jones one-hour chart. Source: Cointelegraph/TradingView
Anticipation of a lasting ceasefire between the US and Iran drove the momentum, even as military strikes continued.
Commenting, trader and analyst Michaël van de Poppe argued that geopolitical changes could still save the Bitcoin price trend.
“Bitcoin is about to collapse to lows, if this level of support doesn't hold. That's just the reality,” he wrote in a post on X.
“Anything between $72,000-74,000 is crucial and could be the end of the correction, especially if Trump comes with a new deal --> rates go down --> oil goes down --> risk-on assets (especially crypto) go higher.”
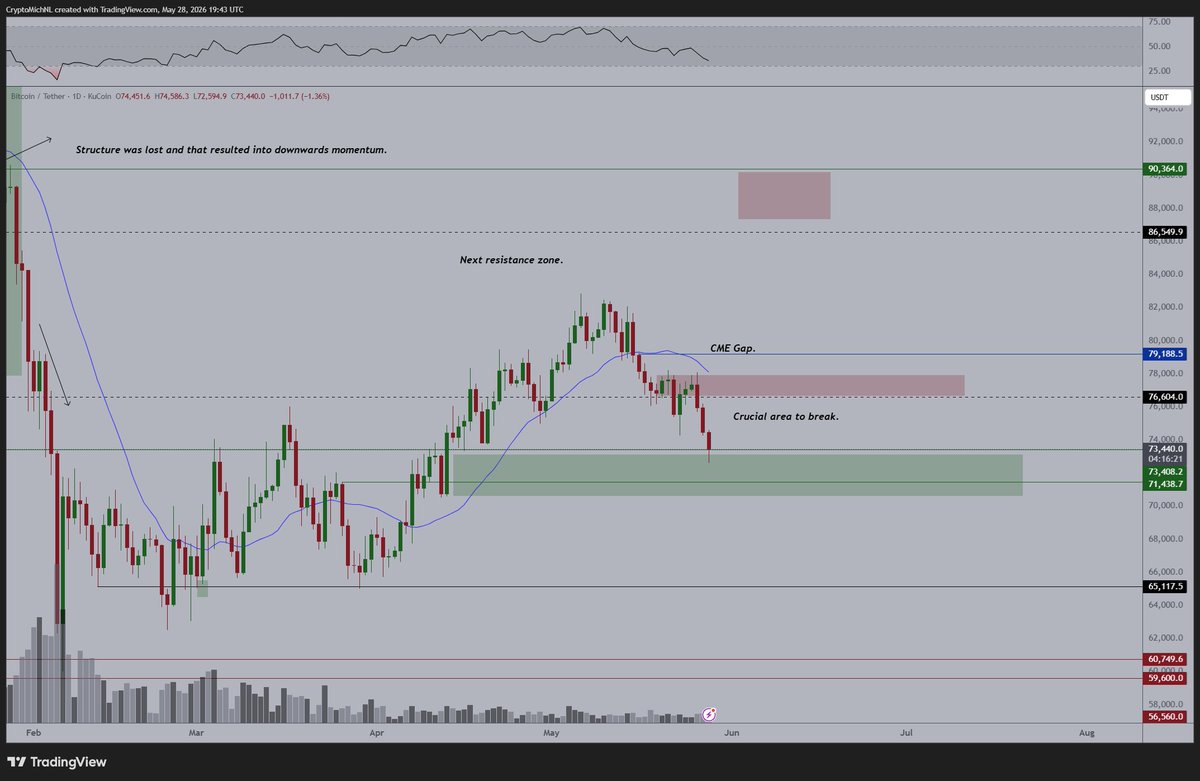
BTC/USDT one-day chart. Source: Michaël van de Poppe/X
Van de Poppe suggested that $77,000 was the line in the sand to start the “next leg upwards.”
“If that doesn't happen, then we're about to witness another leg towards the lows and probably new lows on the altcoin markets,” he added.
Weekly close tipped to see extra volatility
Continuing the general sense of caution among Bitcoin market participants, trading account CGT Trader warned that BTC long positions could face liquidation next.
Related: Bitcoin bids farewell to CME futures gaps with $67K still on radar
“Long squeeze loading …. Price continues to range while funding stays heavily positive and open interest keeps declining. That usually suggests the market is still leaning aggressively long, even as some participants are already closing positions and derisking,” an X post read.
“At the same time, spot volume continues to fade, which points toward underlying weakness. Given these conditions, a long squeeze looks increasingly likely.”
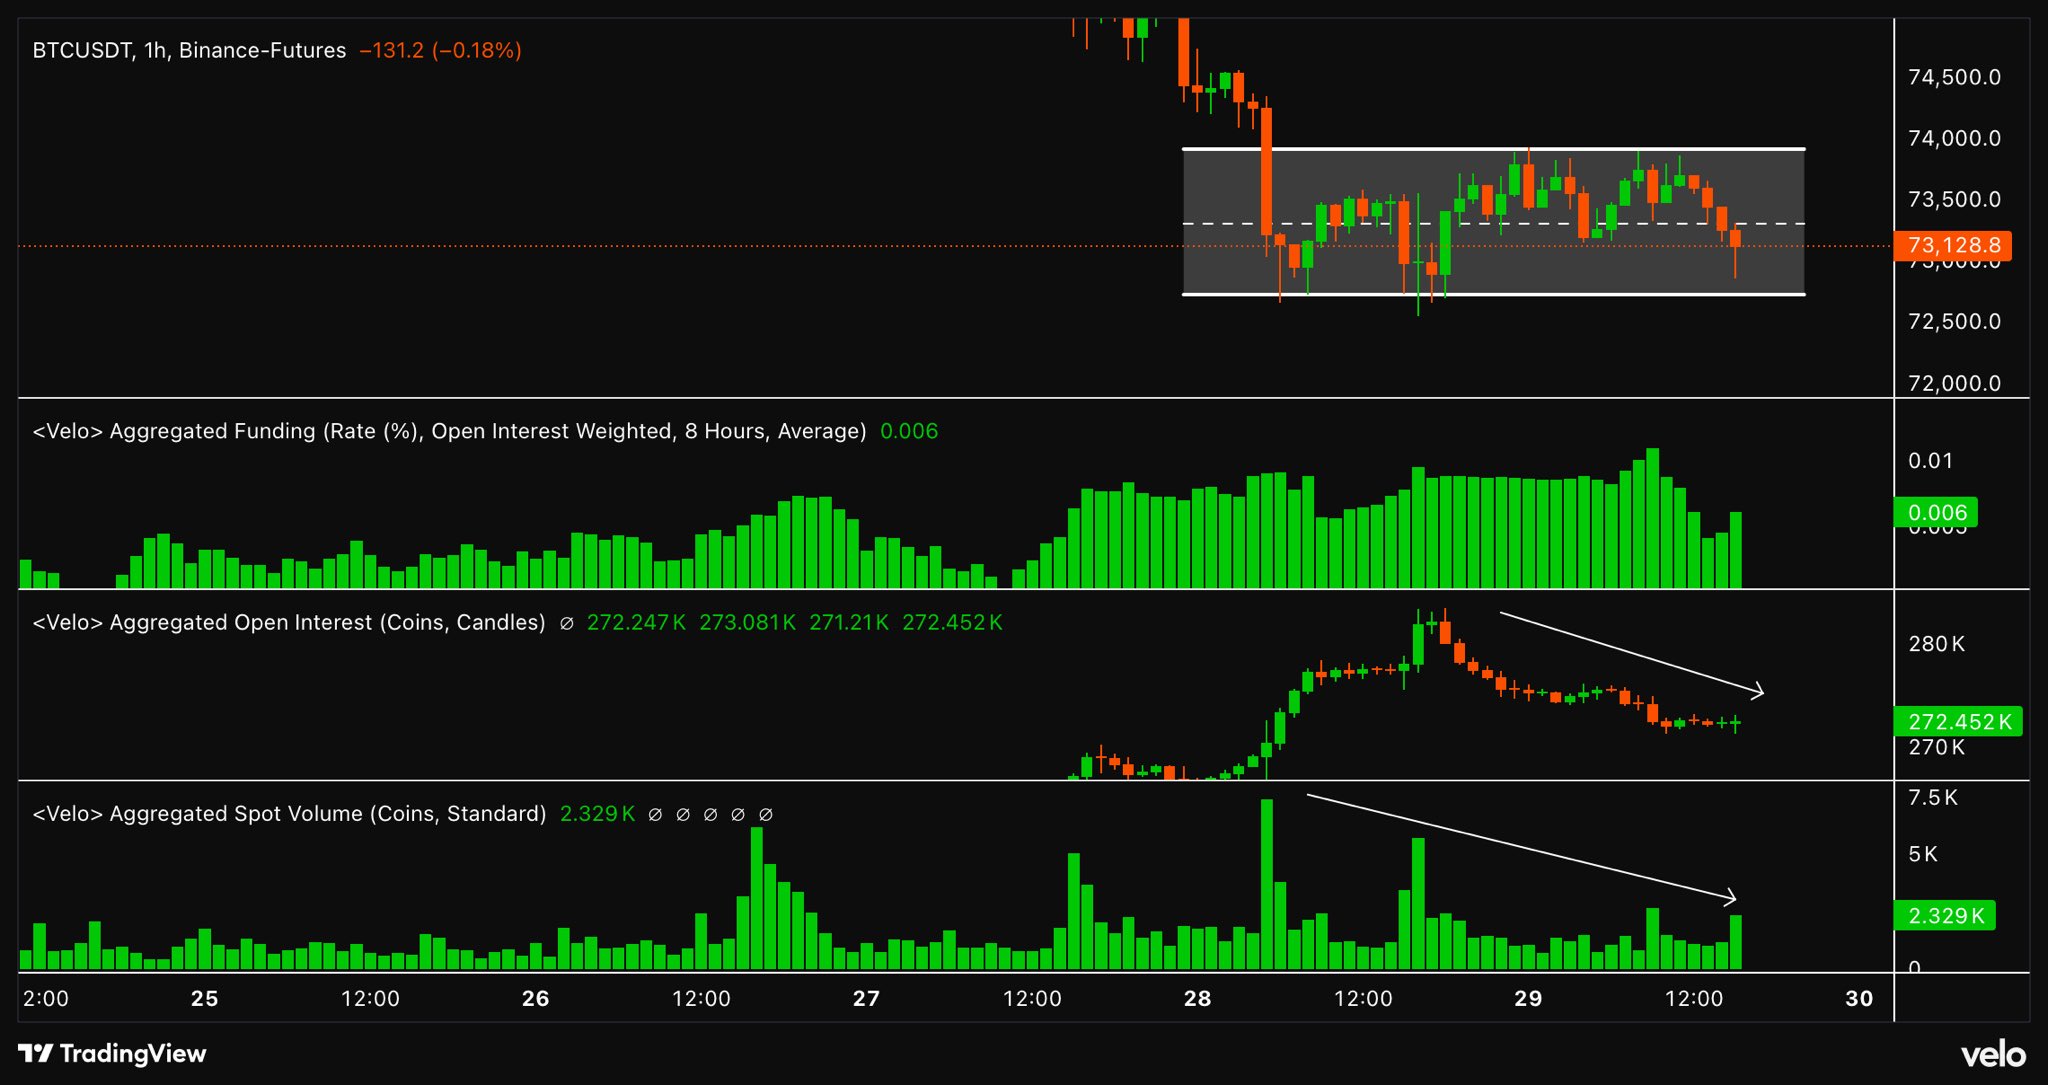
Binance BTC/USDT futures order-book data. Source: CGT Trader/X
Data from CoinGlass showed the total 24-hour cross-crypto liquidations passing $200 million at the time of writing.
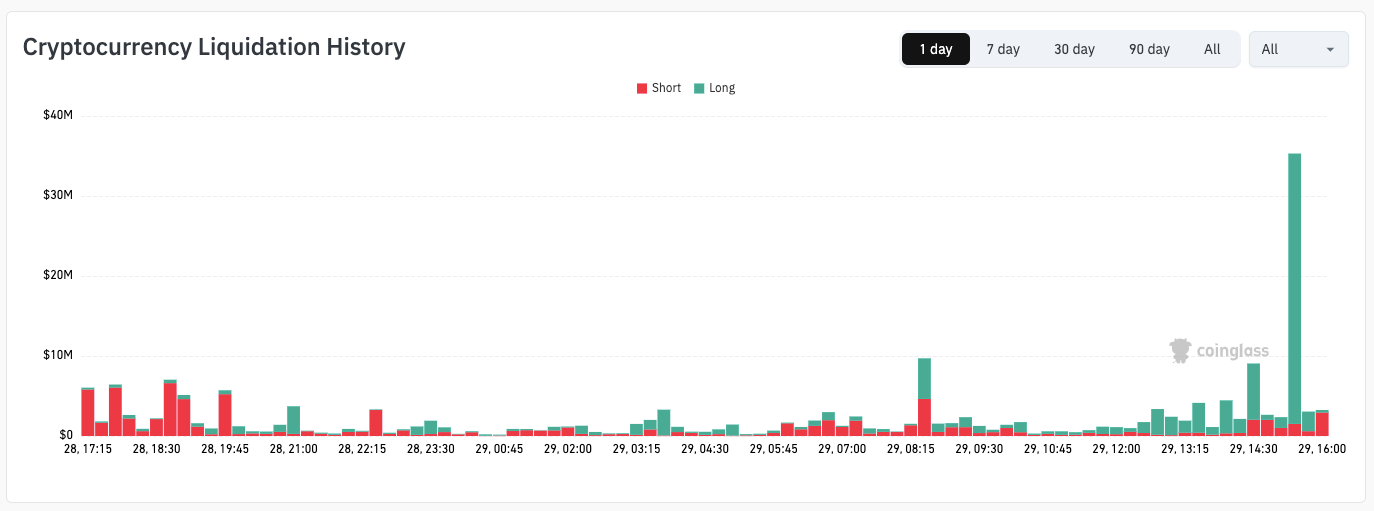
Crypto liquidation history (screenshot). Source: CoinGlass
Looking ahead, trading resource Material Indicators told followers to “expect volatility” on Bitcoin as Sunday’s joint daily, weekly and monthly close approached.
“We have a cluster of liquidations around $76k and a developing H & S pattern that could take price down to the Q2 Timescape R/S Levels in the$68k - $69k range,” it noted, referring to data from its proprietary trading tools.
“The big tells will be whether bulls can rally from the 100 DMA, and how Weekly RSI is trending after the W close.”
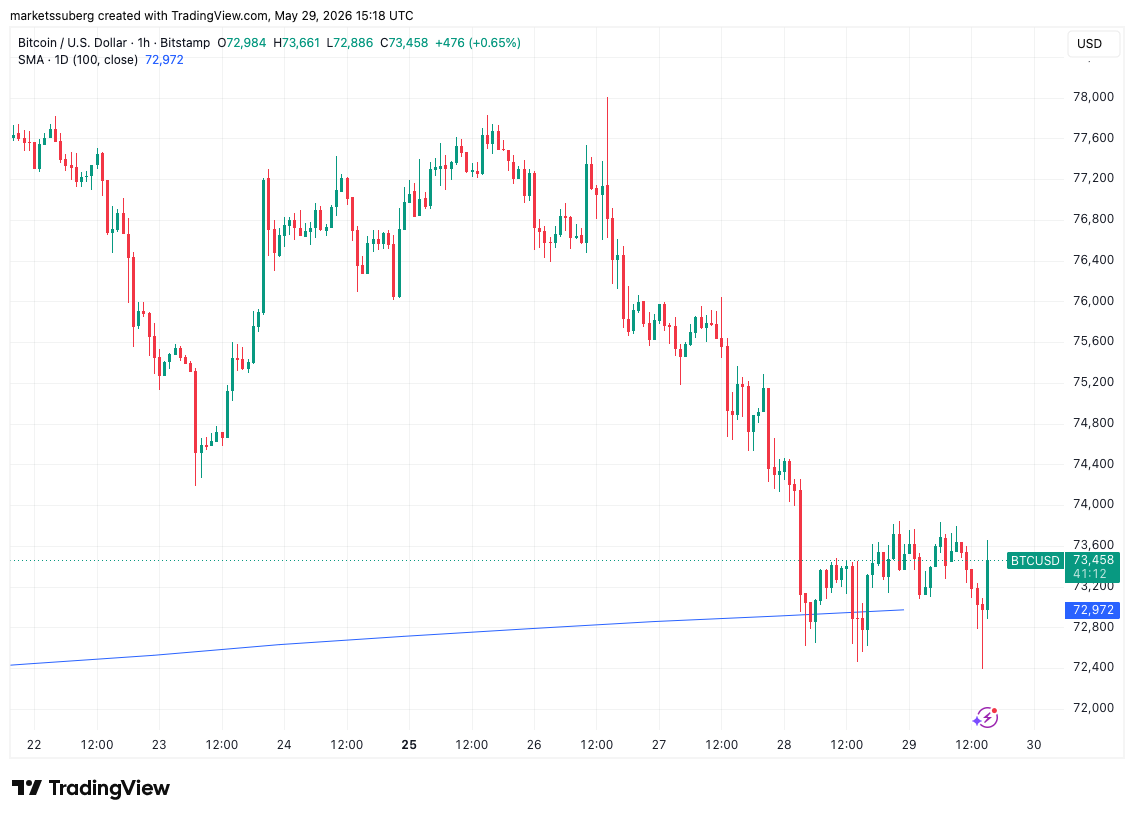
BTC/USD one-hour chart with 100-day SMA. Source: Cointelegraph/TradingView
Material Indicators referenced the 100-day simple moving average, currently at $72,972.
Disclaimer: The content of this article solely reflects the author's opinion and does not represent the platform in any capacity. This article is not intended to serve as a reference for making investment decisions.
You may also like
The Shopify Stock Rally Isn't Done: Chart of the Week -- Barrons.com
By Doug Busch Shopify is no longer a pandemic-era growth story that simply failed to slow down. It is compounding at a pace few software platforms its size still manage. In the second quarter of 2026, sales on its platform rose 32%. That was the fifth straight quarter of growth exceeding 30%. Merchants are also using more of Shopify's own tools, from payments to Shop Pay, and new channels like AI shopping agents are starting to increase demand. The simple bull case is that the stock already commands a huge share of independent online commerce, and that position should become more valuable as more buying moves through its checkout. A rule of market mechanics is that the vast majority of an individual security's gain is driven by its underlying sector. Within technology, software has staged a robust recovery, joining semiconductors to power the broader sector higher. The iShares Expanded Tech-Software Sector ETF has maintained an upward trajectory since its mid-April lows, though the advance from $74 to $112 has been choppy as bulls repeatedly stepped in to defend when necessary. Breadth across large-cap software has expanded significantly, with 24 constituents surging over 20% over the past three months. During that same three-month window, Shopify generated outstanding relative strength, advancing 36%, more than doubling the IGV's 17% gain over the same period. Expect the stock's outperformance to persist as software momentum broadens. Let's examine the daily and monthly charts to outline the technical drivers behind this thesis. Looking at the daily chart, the ratio chart against the IGV shows persistent outperformance extending back to mid-May. The stock is riding an eight-session winning streak, during which price action cleared a double-bottom-with-handle pivot at $151.39. Within this broader base, the stock recorded a bullish golden cross in late August and successfully filled its Sept. 10 price gap, tracing back to its Aug. 4 session, the day before a powerful earnings reaction sent the stock surging 17% hi
TRexBio: IPO Of 8.3M Shares Priced at $14.00 Each >TRXB
TRexBio: IPO Of 8.3M Shares Priced at $14.00 Each >TRXB
Talos Energy director Barbara J. Faulkenberry files initial beneficial ownership statement
Talos Energy director Barbara J. Faulkenberry filed an initial Form 3 statement dated Oct. 1, 2026. Disclaimer: This news brief was created by Public Technologies (PUBT) using generative artificial intelligence. While PUBT strives to provide accurate and timely information, this AI-generated content is for informational purposes only and should not be interpreted as financial, investment, or legal advice. Talos Energy Inc. published the original content used to generate this news brief via EDGAR, the Electronic Data Gathering, Analysis, and Retrieval system operated by the U.S. Securities and Exchange Commission (Ref. ID: 0001193125-26-418248), on October 08, 2026, and is solely responsible for the information contained therein.
Crypto prices
More


