A seasoned crypto market analyst is pushing the idea of Stellar Lumens (XLM) leading Solana (SOL), as the utility-driven rally last week pushed XLM several spots up the global crypto charts. Judging from the side-by-side shared price charts by Ali Martinez, highlighting extremely similar volatility.
With Stellar Lumens (XLM) breaking out to claim $0.248 last week, many traders see that as a potential precursor for Solana’s (SOL) performance. With XLM setting up the trends for the broader altcoin market, this could lead to a larger portion of market dominance for Stellar (XLM).
$114 Trillion Giant Picks Stellar First – TOP 10 Next?
Last month, the Depository Trust & Clearing Corporation (DTCC) shook the markets following the announcement of their tokenized versions of traditional assets going live on Stellar’s network in early 2027. This integration immediately manifested itself in a 64% rally for XLM’s price in the next few days, as America’s largest clearing house is set to deploy assets, including:
- Russell 1000 stock market items
- Exchange-traded funds (ETFs)
- United States treasury funds
All in all, the DTCC custodies a gargantuan $114 trillion – a figure roughly 40 times larger than the global crypto market capitalization all combined. While DTCC’s blockchain appreciation plans are not entirely limited to Stellar (XLM), the fact that XLM Network got picked first shows strong potential of the OG altcoin returning to the TOP 10 by crypto’s global market cap.
Trading Volumes Already Depict a Close Competition
Breaking down the market caps, Stellar’s (XLM) trailing behind Solana (SOL) roughly 8 times. Inside the TOP 7, Solana’s (SOL) market capitalization now revolves around $46.8 billion, while the fully-diluted valuation (FDV) counts a figure above $50 billion, according to SoSoValue.
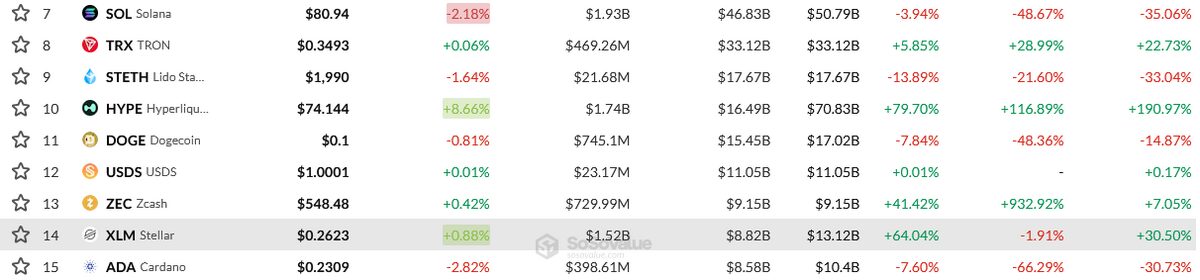
For Stellar Lumens (XLM), the situation is similar at #14 – the realized market capitalization is at $8.8 billion, while the FDV sits at $13.02 billion. The difference between FDV is even bigger in XLM’s case, which hints at unrealized potential.
The daily trading volume is another crucial tell – Solana’s $1.91 billion in 24 hours edges the $1.51 billion traded on Stellar, but the discrepancy is way smaller than by comparing market caps.
If billions of dollars keep flowing through Stellar (XLM) on a regular basis, XLM could follow in the footsteps of Ripple’s XRP coin, while simultaneously dictating the broader major-cap alt trend.
People Also Ask:
Traders are asking whether Stellar (XLM) can actually overtake Solana (SOL) in market cap. While XLM is still much smaller, its trading volume is getting dangerously close to SOL’s.
There’s still a huge gap. Stellar’s market cap is around $8.8 billion, while Solana sits at $46.8 billion — over 5x larger. XLM has a long way to go in total size.
Very close. Stellar’s daily trading volume is currently $1.52 billion, while Solana’s is $1.93 billion. That’s fierce competition and shows real money is flowing into XLM right now.
High volume usually means strong interest and liquidity. If Stellar can keep this kind of volume for a while, it can attract more attention, new buyers, and potentially close the market cap gap faster than people expect.