
The scenario on $XLM revolves around 0.26: daily pivot and contact with the upper band. The structure remains bullish, now in high consolidation. In a more cautious context, the $XLM price shows resilience, but a decisive close above 0.27 is needed to avoid a pullback.
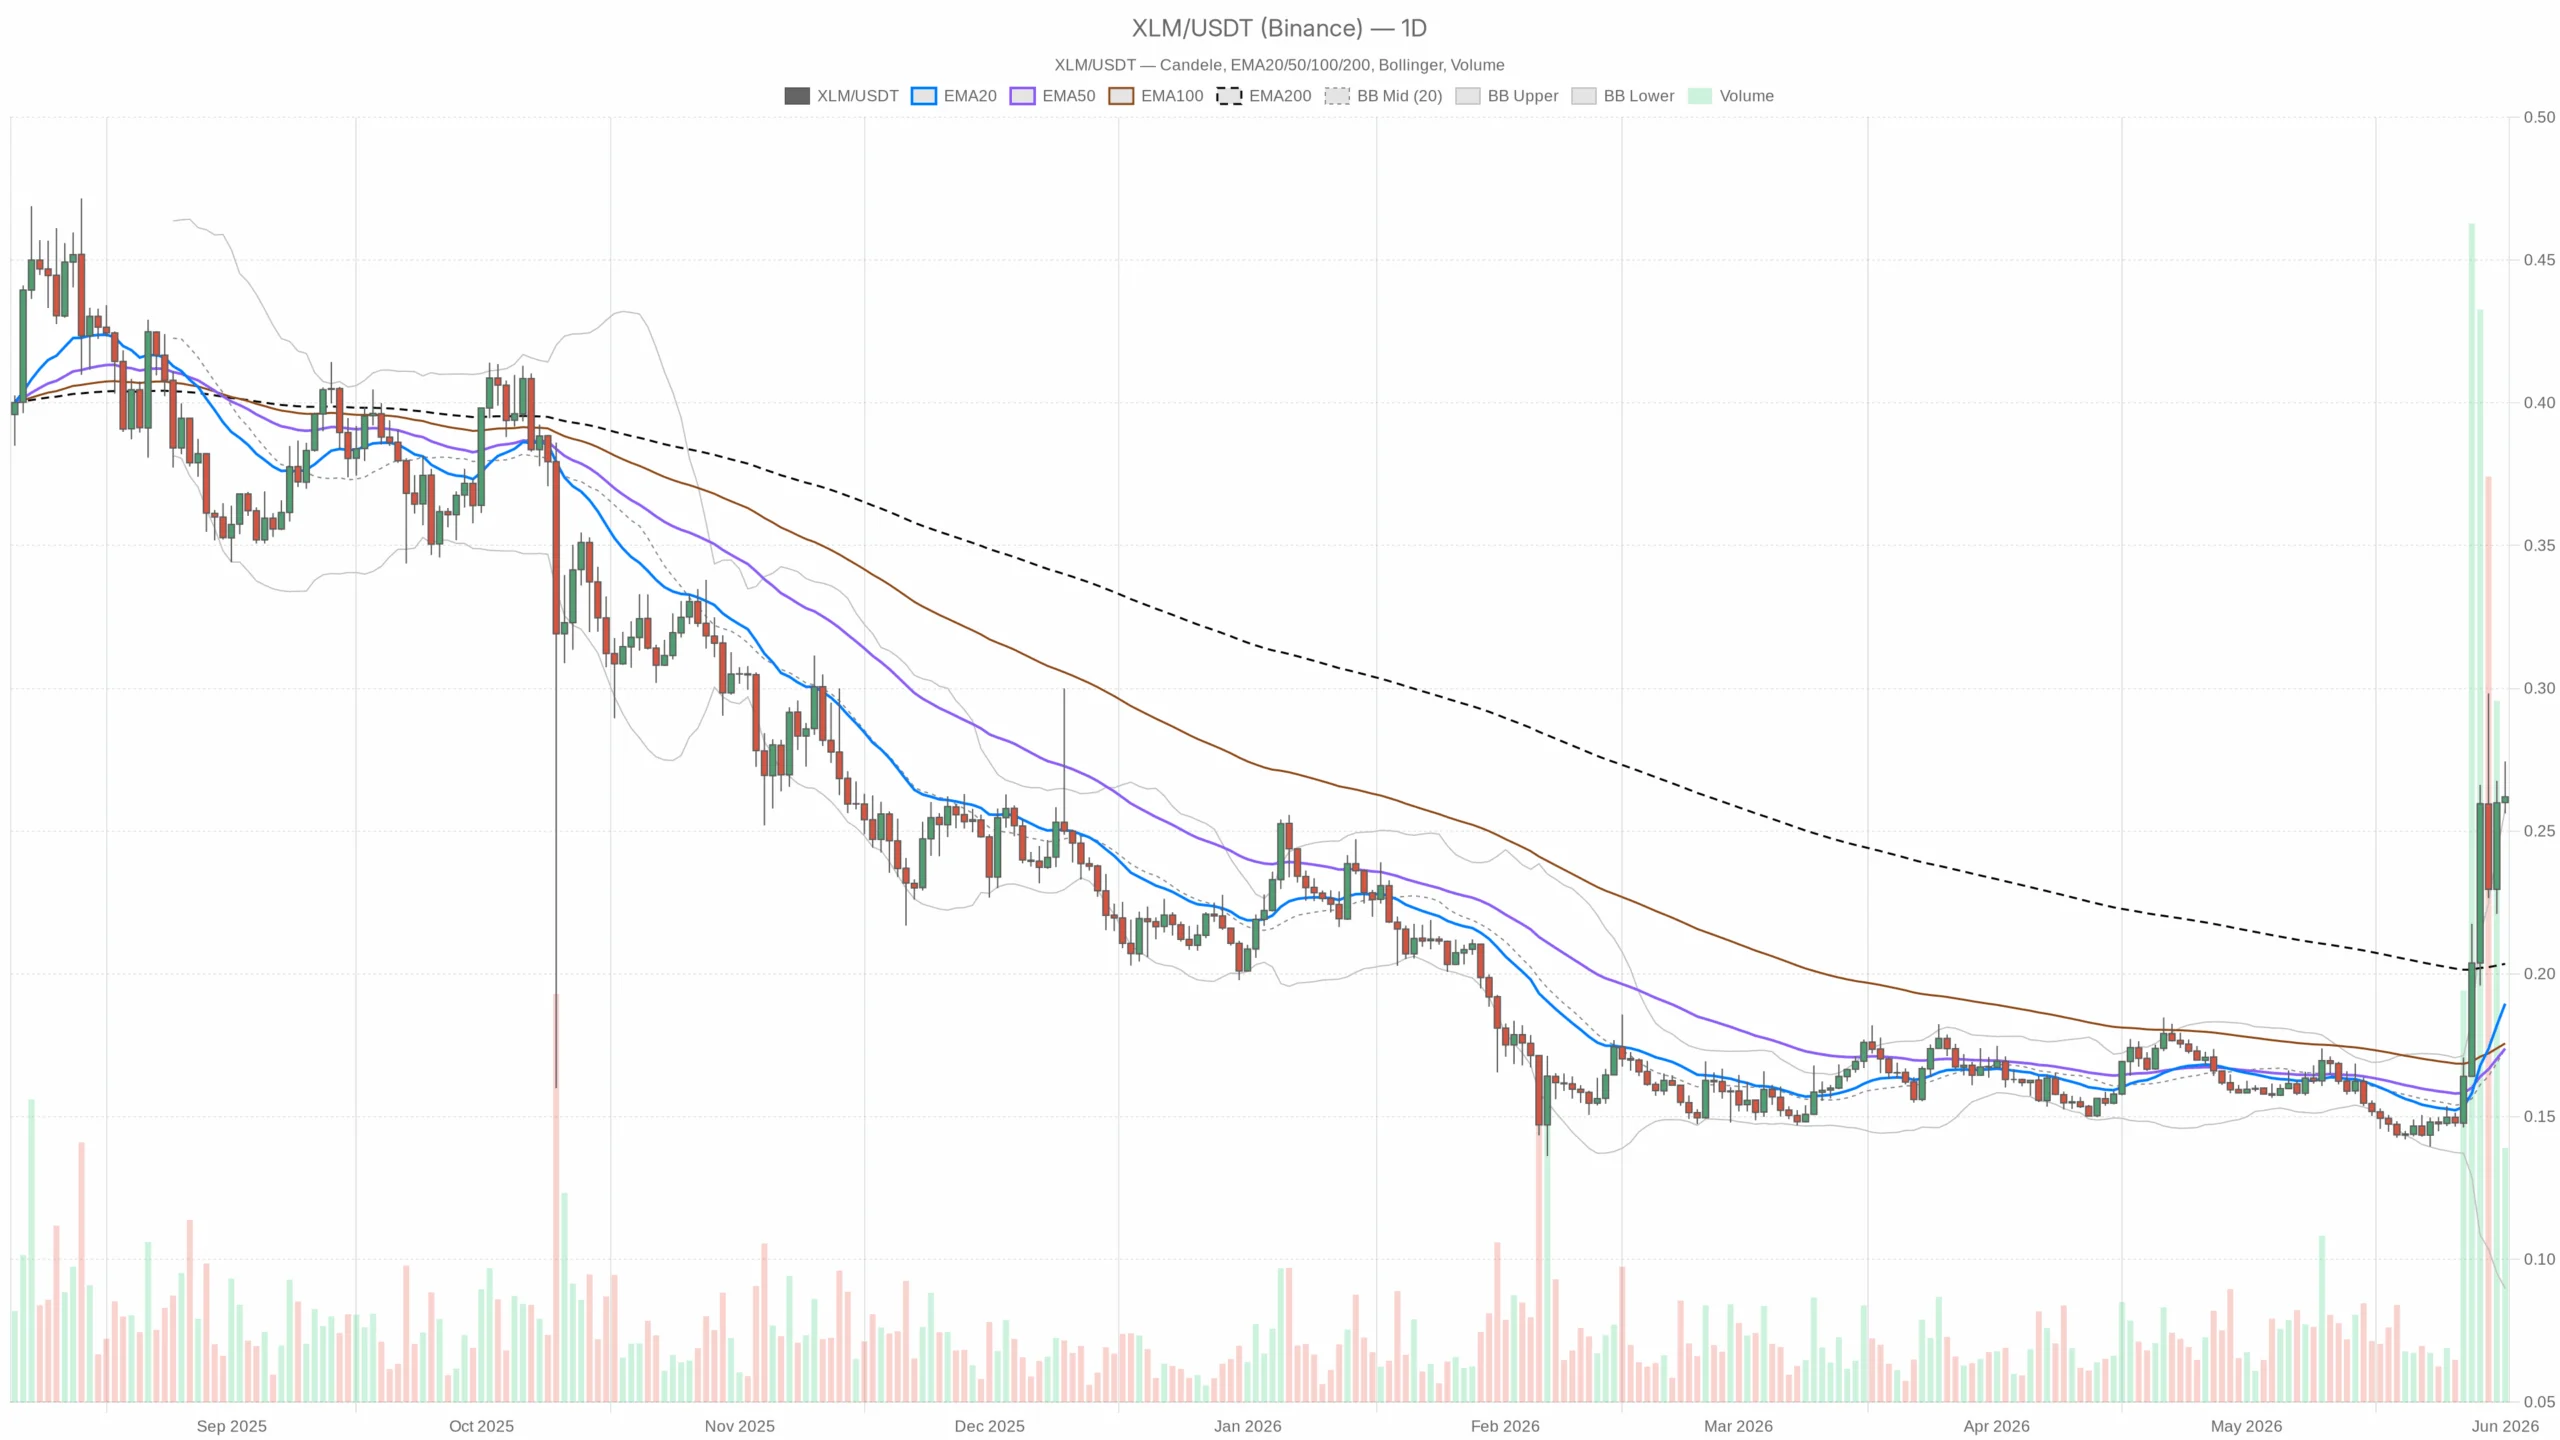 $XLM/
$USDT — daily chart with candles, EMA20/EMA50 and volumes.
$XLM/
$USDT — daily chart with candles, EMA20/EMA50 and volumes.
Context and price behavior
The daily chart highlights a strong rise with price around 0.26 $USDT. The market is accepting high prices: on the 1H time frame the price is leaning on the moving averages. On the 15m the balance is very compressed. In practice, push and then breath; now directionality is needed to unlock the 0.25–0.27 range. For those following the $XLM price live or looking at $XLM in euros, the technical reading does not change. The key levels remain the same, with the conversion linked to the EUR/USD exchange rate.
Daily (main direction)
- EMA (20=0.19; 50=0.17; 200=0.20) with price at 0.26 well above all the averages. This shows a strong trend, but also a wide distance from the fast average. Ground is ripe for consolidation if new highs do not arrive.
- RSI 14 = 75.47. Powerful but stretched momentum. The risk is a normalization towards the 60–65 area if buyers slow down.
- MACD line 0.02 above signal 0.01 (positive hist 0.01). Push still in favor of longs, without explosive acceleration. A break of 0.27 is needed to reactivate a steeper slope.
- Bollinger: mid 0.17; upper band 0.26; lower band 0.09. Price in contact with the upper band: a trend signal, with risk of re-entry if volatility does not continue to widen.
- ATR 14 = 0.02. Wide daily range for $XLM. At these levels it equals several percentage points; false breaks can be costly if you enter late.
- Pivot (D1): PP 0.26; R1 0.27; S1 0.25. The game is played on holding 0.26 and on the ability to break through 0.27 without rejections.
1H (confirmations/weakening)
On 1H the picture remains constructive: price around 0.26, in line with EMA20, and above EMA50 (0.25) and EMA200 (0.21). RSI 55.6 indicates a positive, not overheated tone. MACD slightly positive. In short, buyers control the pace, but must confirm above 0.27.
15m (operational context)
Neutral time frame: EMA20 roughly equal to EMA50 at 0.26, RSI 46 and flat MACD. ATR almost zero: tight micro-range, typical pre-move. That said, the edge is low for those chasing; better to wait for range expansion or returns to key levels.
Levels that matter
- Resistance: 0.27 (R1 D1 and upper band 1H). Beyond this step, room for extensions towards 0.285–0.30 if the bands open.
- Control area: 0.26 (PP D1, mid band 1H, EMA20 1H). It is the intraday watershed.
- Support: 0.25 (S1 D1). A clear loss reopens 0.24, then 0.21–0.20 as deeper defense.
Main scenario and alternative plans
Main thesis (D1): bullish but extended. The market is building a high base between 0.25 and 0.27. A convincing break of 0.27 would validate continuation; a loss of 0.25 would impose a mean reversion phase.
- Plausible bullish scenario: holding 0.26 with absorption of supply at 0.27 and hourly closes above R1. In this case momentum can reignite towards 0.285–0.30. Invalidation: 1H close below 0.25 or daily falling back below 0.26 with cooling RSI.
- Plausible bearish scenario: failure at 0.27 and loss of PP 0.26, then acceleration below 0.25 towards 0.24. If the market context remains fearful, possible extension towards 0.21–0.20. Invalidation: recovery and holding above 0.27 with increasing volatility in favor of buyers.
How to read the context now
In a more cautious market, with high Bitcoin dominance and fearful sentiment, the Stellar price shows relative strength. However, this is not a green light to chase. Stretched RSI on D1 and price on the upper band increase the risk of false breakouts. Operationally, those analyzing $XLM can:
- Use 0.26 as an intraday bias trigger: above it you look for confirmation of strength, below it you favor patience.
- Fade the extremes of the 0.25–0.27 range only with clear signals on 1H, avoiding late entries given the high daily ATR.
- For forecasts on the value of Stellar: continuation requires expanding Bollinger band and closes above 0.27; without that, sideways movement or a return towards 0.25 is likely.
The $XLM price remains in unstable balance on a watershed. The next move from the 15m micro-range will set the tone: expansion above 0.27 to relaunch the trend, or quick flush below 0.25 as a classic false signal. Finally, watch risk management: the average daily range can amplify entry errors.