

 thecryptobasic.com
The $XRP RSI on the weekly timeframe has flashed an extremely rare oversold signal amid the latest crypto market crash.
The $XRP Relative Strength Index (RSI) collapsed below the 30-mark on the weekly chart. This is particularly noteworthy because, before now, the momentum indicator had only dropped below this level once in $XRP’s history, and it marked the bottom of that bear market.
Key Points
- The latest market-wide crash has pushed $XRP’s price back to $1.11, leading to a 17% drop this month.
- Amid the renewed pressure, the weekly $XRP RSI recently collapsed below the 30-mark.
- This event has played out only once in $XRP’s entire history, making the recent occurrence particularly noteworthy.
- When the weekly RSI dropped to similar levels in June 2022, it aligned with $XRP’s bottom of $0.28 during that cycle’s bear market.
$XRP Seeing a Brutal Week
Evan Clegg, a well-known market commentator, spotted this development as the crypto market suffers another wave of renewed selloffs.
Notably, shortly after Michael Saylor’s Strategy confirmed selling 32 Bitcoin ($BTC), representing only a minute portion of their over 800K tokens, $BTC crashed, dragging the rest of the crypto market with it.
While Saylor recently suggested that the renewed pressure was due to capital rotation toward AI, altcoins like $XRP have suffered intense burns. Specifically, $XRP has collapsed 16% this week, on track to record its most brutal weekly loss since early March 2025 unless a rebound occurs.
This drop has pushed $XRP to the $1.11 level for the first time since February 2026, bringing the crypto asset close to its lowest price of the year. $XRP is now down more than 17% this month, with only 5 days in, and by a more substantial 39.47% year-to-date.
Weekly $XRP RSI Drops to Rare Oversold Level
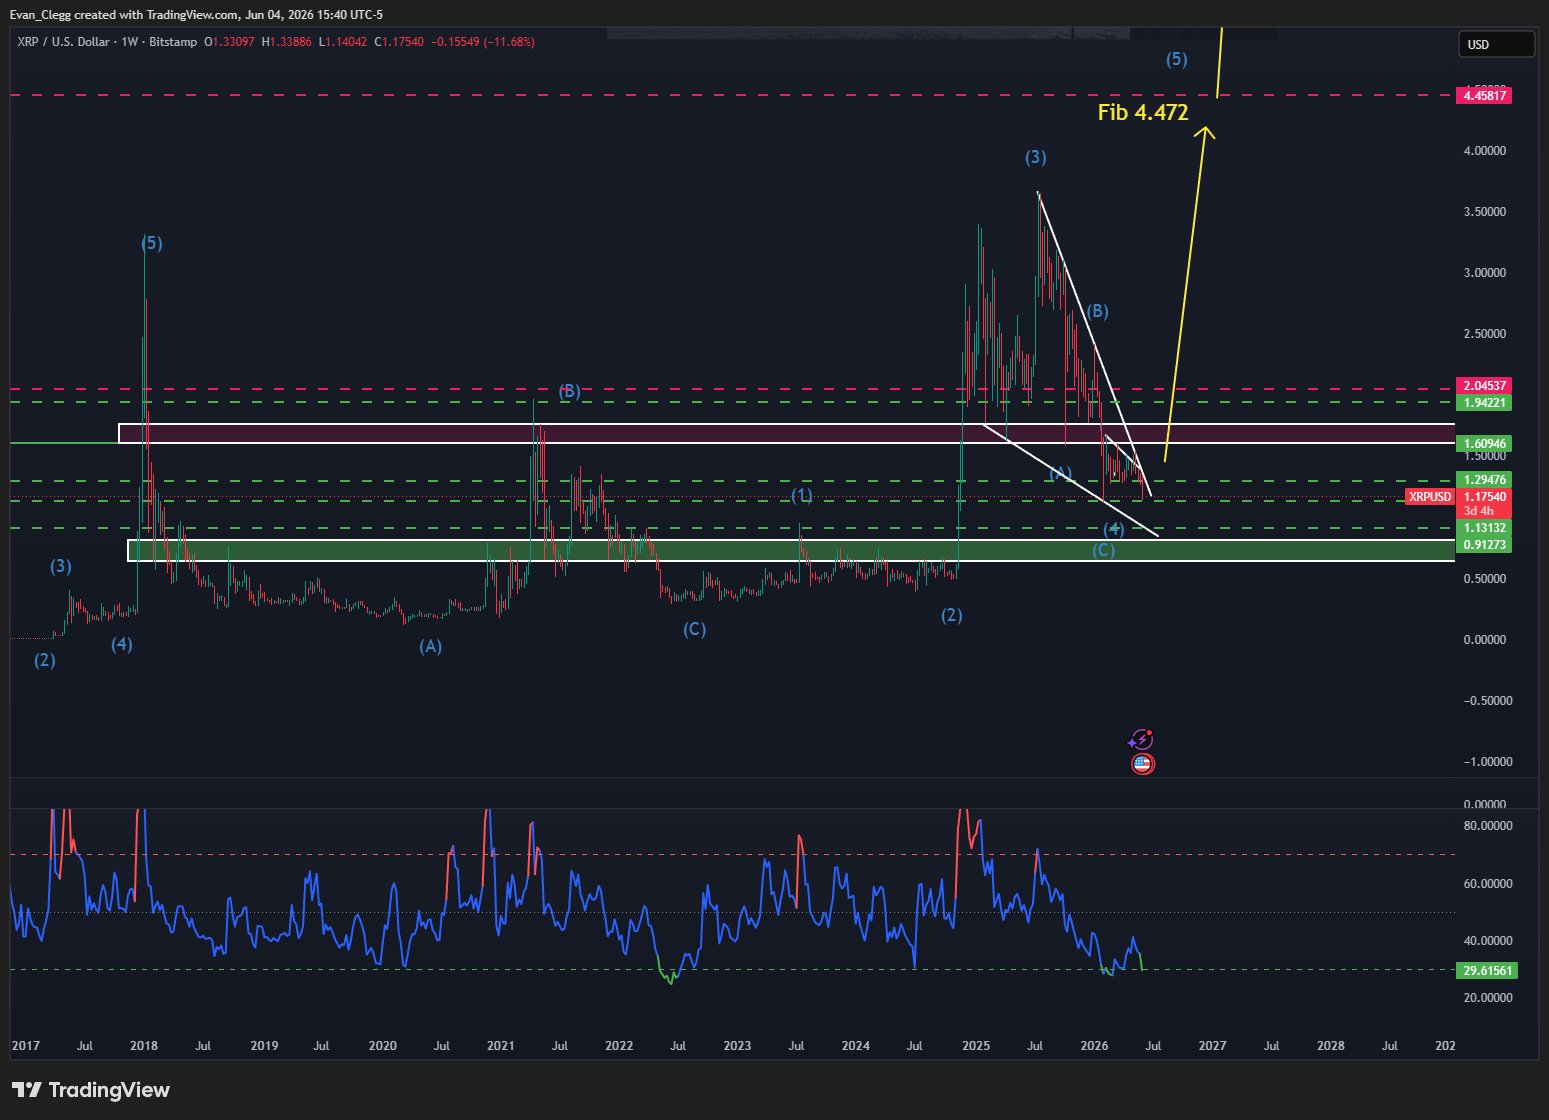
Amid the sharp downturn, Clegg found that the weekly $XRP RSI has collapsed below the 30-mark, specifically reaching a low of 29.6. This resulted in the RSI indicator flipping to a rare green color on the weekly timeframe. According to Clegg, this green flash only occurs at extreme lows.
Interestingly, data from the chart shows that throughout $XRP’s entire history, the weekly RSI had only dropped to similar levels once before the latest occurrence. This first instance played out during the 2022 bear market, when the RSI crashed to 28.09 in June.
 $XRP Weekly RSI | Evan Clegg
Notably, the drop aligned with an $XRP price collapse to $0.28 that week, which marked $XRP’s bottom for that period. From here, the price only saw higher lows and consistent rebounds until it claimed the $0.94 high in July 2023 on the back of the favorable ruling in the SEC lawsuit.
What’s Next for $XRP?
With this rare RSI signal repeating, it may also mark $XRP’s bottom for this cycle. However, this remains inconclusive at press time. Clegg pointed out that the ongoing decline represents a corrective Wave 4 within a larger Elliott Wave structure that has been playing out since July 2023.
According to the market analyst, Wave 4 is now on the verge of completion, which could usher in the fifth wave. Clegg’s chart suggests Wave 5 may bring in the much-needed rebound push, possibly pushing prices to a new all-time high around $4.4. This aligns with the Fibonacci 4.472 extension.


