

 ambcrypto.com
Dash [$DASH], the privacy-focused cryptocurrency, is now facing its Waterloo, as the technical outlook turns increasingly unfavorable for the asset.
The cryptocurrency, after staging an anomalous run that rallied it 427% to $150 after the liquidation event on the 10th of October, and has since slid steadily and now sits on the verge of erasing those gains entirely should it break below $28.
Over the past 24 hours, that prospect has edged closer to reality following a 13% decline, and AMBCrypto assesses in this piece whether the drop is likely to materialize.
$DASH sits one support level from surrendering its entire rally
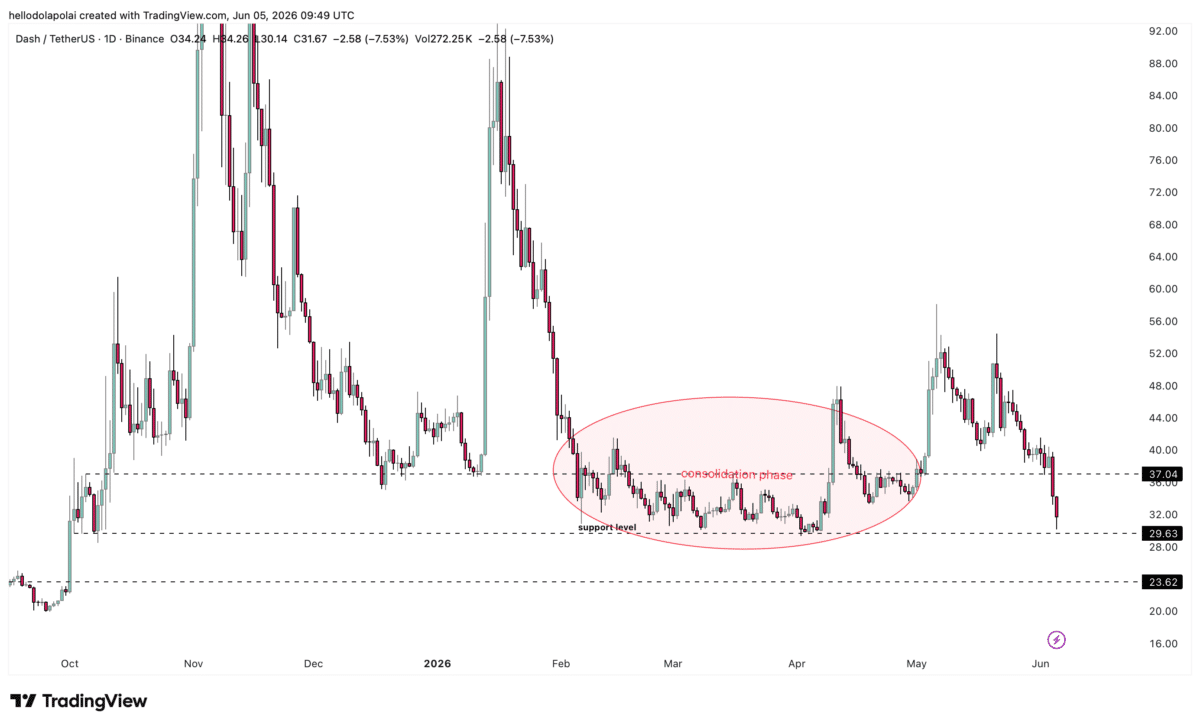
$DASH stands just one technical support level away from wiping out every gain it accumulated over this period.
The support at $29.63 remains critical to the price structure, sitting just above the $28 mark that would confirm $DASH has surrendered its entire October rally. The last time $DASH traded into this level, it triggered a significant upward swing across the market.
 Source: TradingView
A breach of this support, confirmed by a lower candlestick formation, would underline the strength of the bears. Such a break could drag $DASH toward $23, the next closest support beneath current prices.
However, $DASH could instead consolidate within a range between $29 and $37, much as it did during the period marked by the oval on the chart.
Momentum indicators point to the bears taking control of $DASH
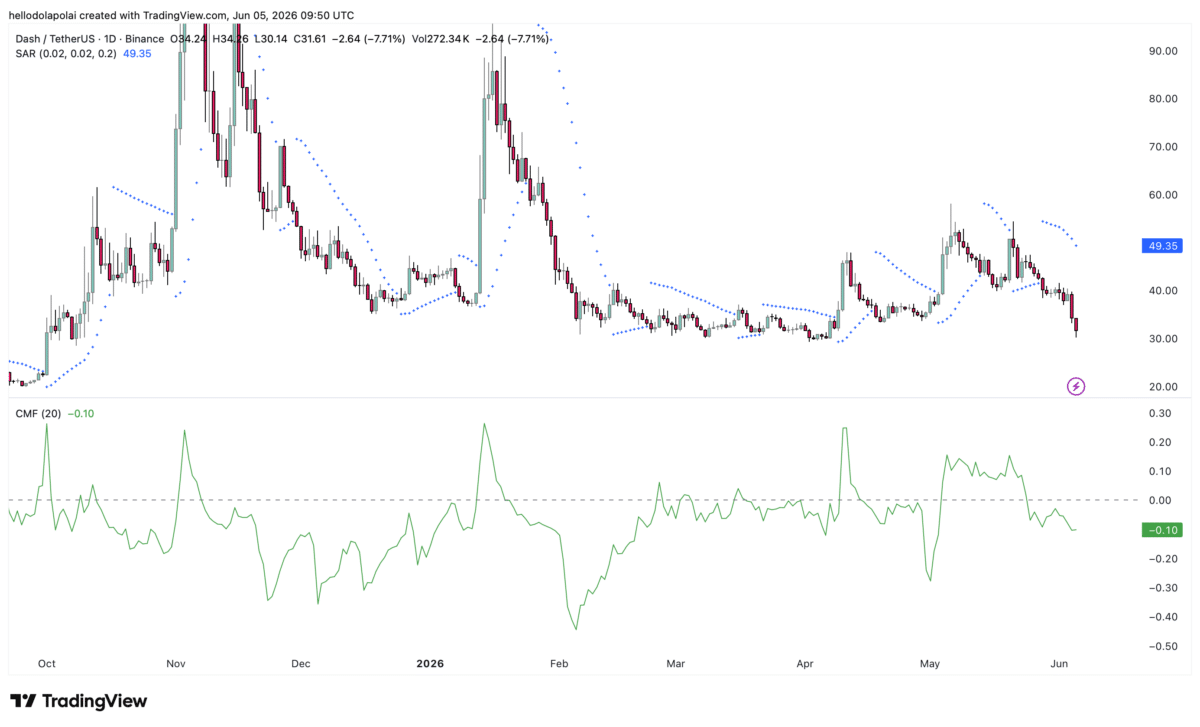
Momentum-based indicators suggest the bears are positioned to kick in and force the price lower, and the Parabolic Stop and Reverse (SAR) makes that case most directly.
The Parabolic SAR gauges an asset’s trend through the placement of its dots. Dots sitting above the price point indicate a downtrend, while dots below it signal an uptrend.
Currently, the dots sit above the price, indicating that sellers hold the upper hand and could weigh on $DASH notably. The Chaikin Money Flow only deepens that already shaky outlook.
 Source: TradingView
The Chaikin Money Flow has fallen into negative territory, printing a -0.10 reading and showing that selling volume now dominates the market and dampens the outlook.
Should these indicators continue to track the bearish pressure, $DASH will likely keep trending lower.
Perpetual market data flags rising downside risk for $DASH
Analyzing exchange activity, particularly the Funding Rate data, remains key to reading the broader setup and tracking how investor capital is moving through the market.
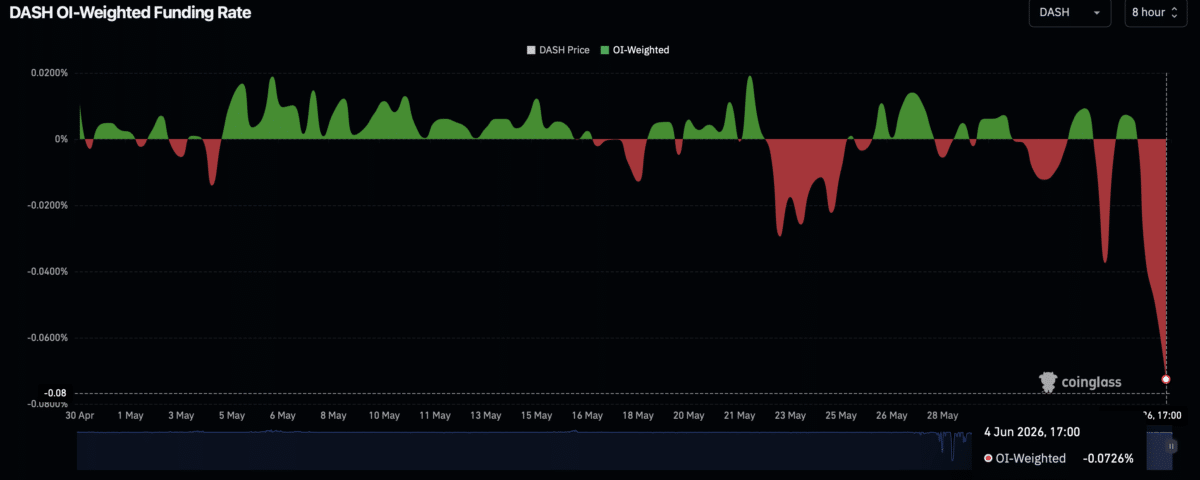
The Funding Rate has turned deeply negative, with the data printing -0.0726%. That implies the majority of the $41.71 million in $DASH perpetual contracts is skewed toward the sell side, and this pressure cumulatively places $DASH at greater risk of a decline.
 Source: CoinGlass
At present, holding a short contract is more profitable than holding a long. Liquidations wiped roughly $698,000 from long positions over the past 24 hours, compared with just $39,620 from shorts.
Final Summary
- $DASH has fallen 13% and is now testing the critical $29 support level; a breakdown could expose a move toward $23.
- Parabolic SAR above price, CMF at -0.10, and negative Funding Rates highlight strong bearish control and rising short-side dominance.


