
Ethereum Price Prediction: How Close Is ETH to a Sub-$1.5K Breakdown?

Ethereum remains under significant selling pressure after losing a major support area and extending its decline toward the lower boundary of its broader trading range. While buyers have managed to defend the range lows for now, the market structure continues to favor the bears unless ETH can reclaim several key resistance levels overhead.
Ethereum Price Analysis: The Daily Chart
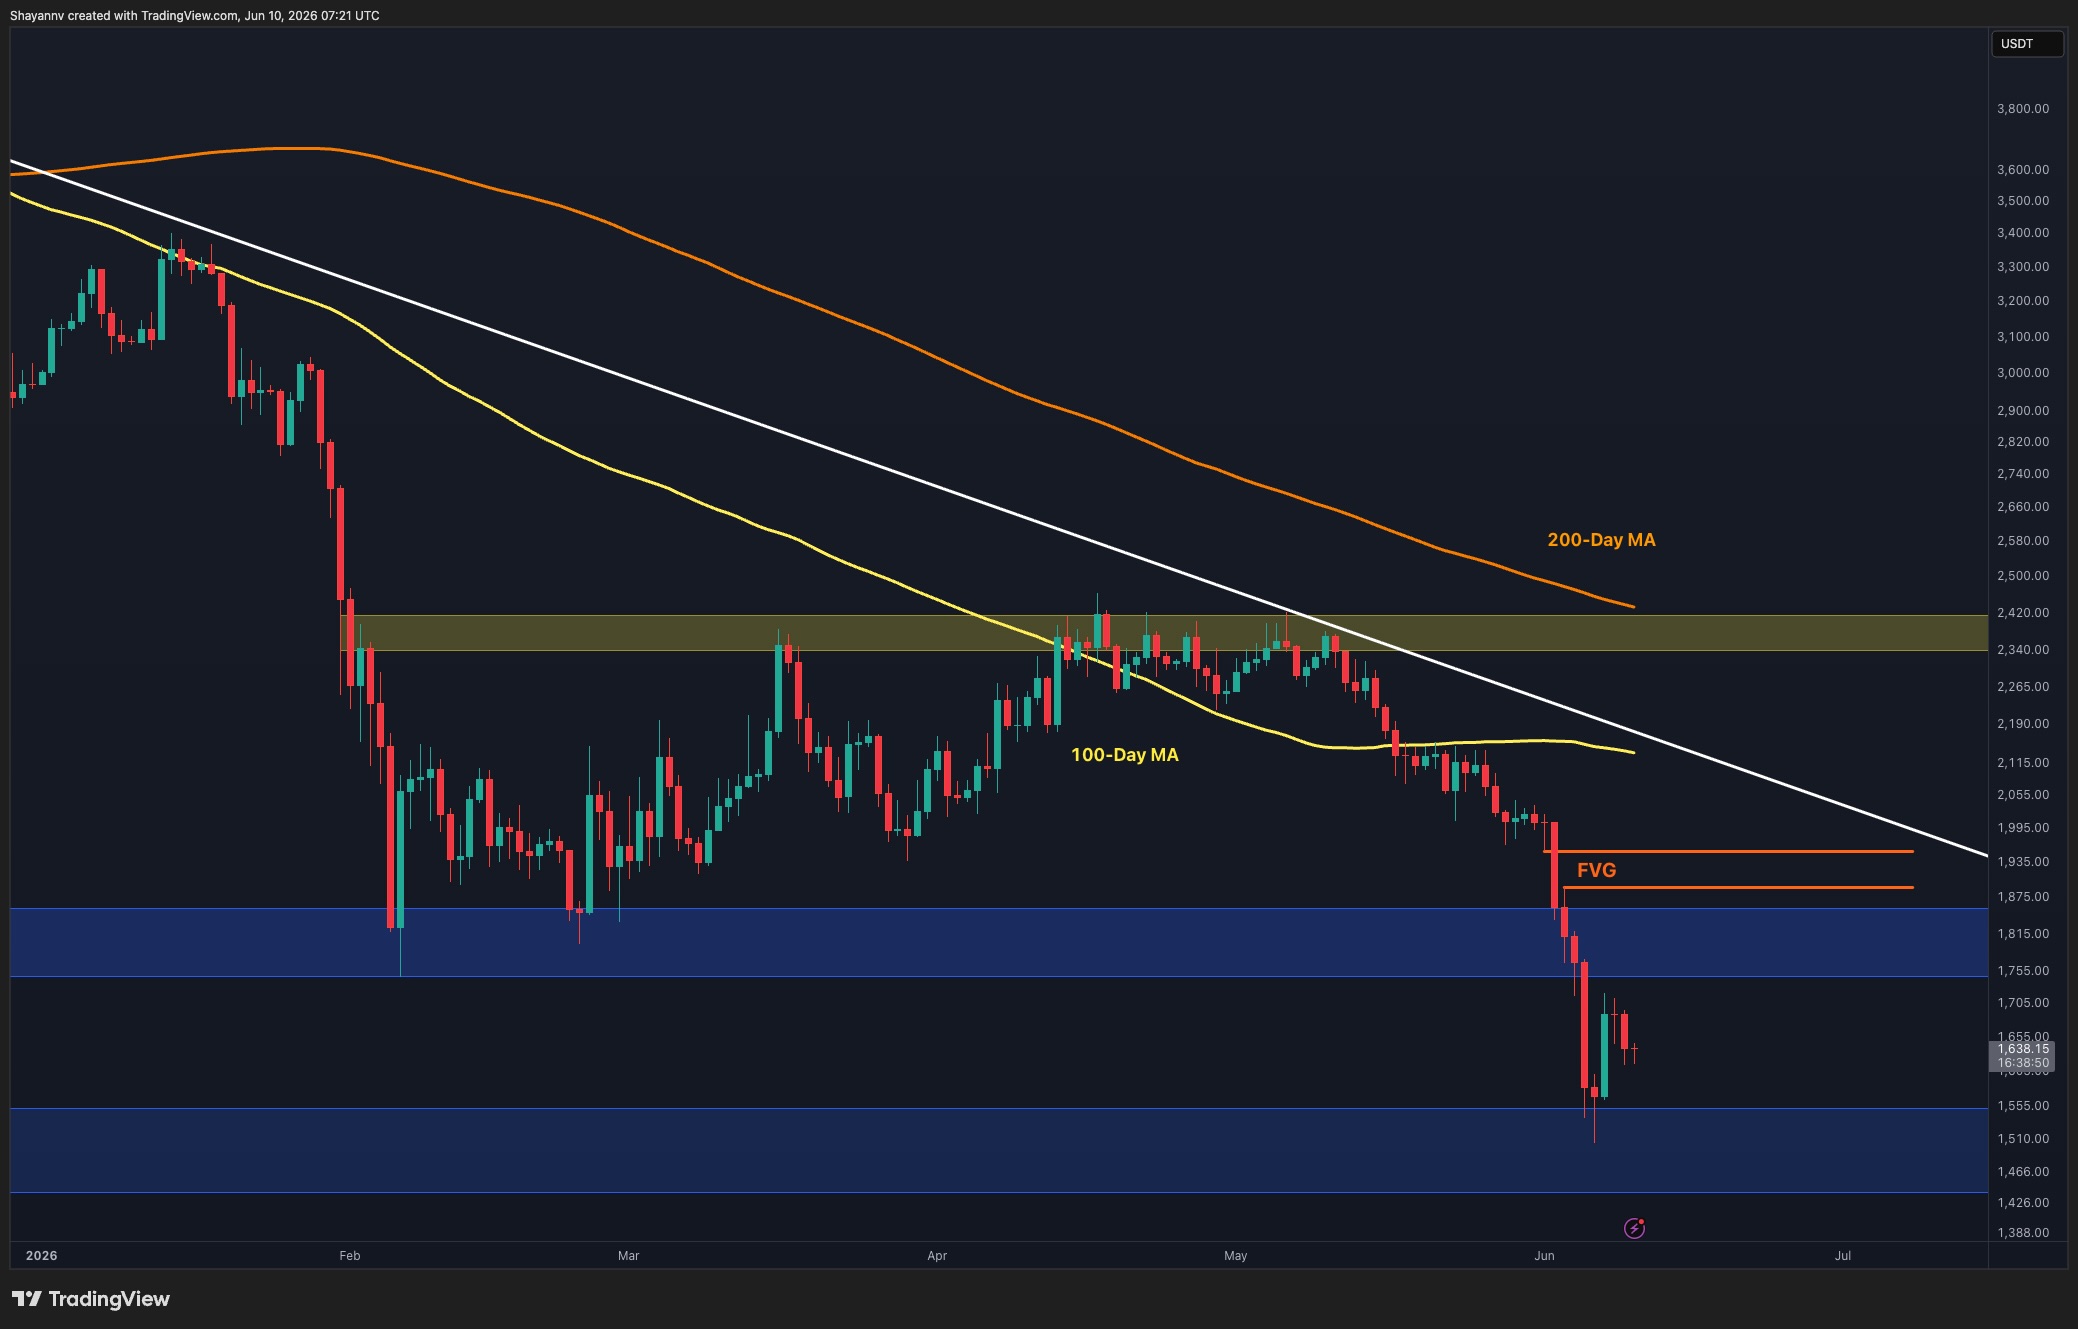
On the daily timeframe, ETH remains trapped within a broad range defined by the upper blue resistance zone around $1.75K-$1.85K and the lower blue demand area near $1.45K-$1.55K.
The recent breakdown below the upper range support marked an important structural shift. ETH lost the $1.8K region and quickly dropped into the lower portion of the range, eventually finding demand just above the lower blue box around $1.5K. The sharp rejection from that zone confirms that buyers are still defending the range floor, preventing a deeper bearish continuation for now.
However, the broader trend remains weak. The asset continues to trade beneath the descending long-term trendline as well as the 100-day and 200-day moving averages, all of which are sloping lower. This alignment suggests that sellers still maintain control despite the recent bounce.
As long as ETH remains between the two blue zones, the market can be viewed as range-bound rather than trending. The lower blue box around $1.45K-$1.55K remains the primary support area, while the upper blue box around $1.75K-$1.85K now acts as the first major resistance.
ETH/USDT 4-Hour Chart
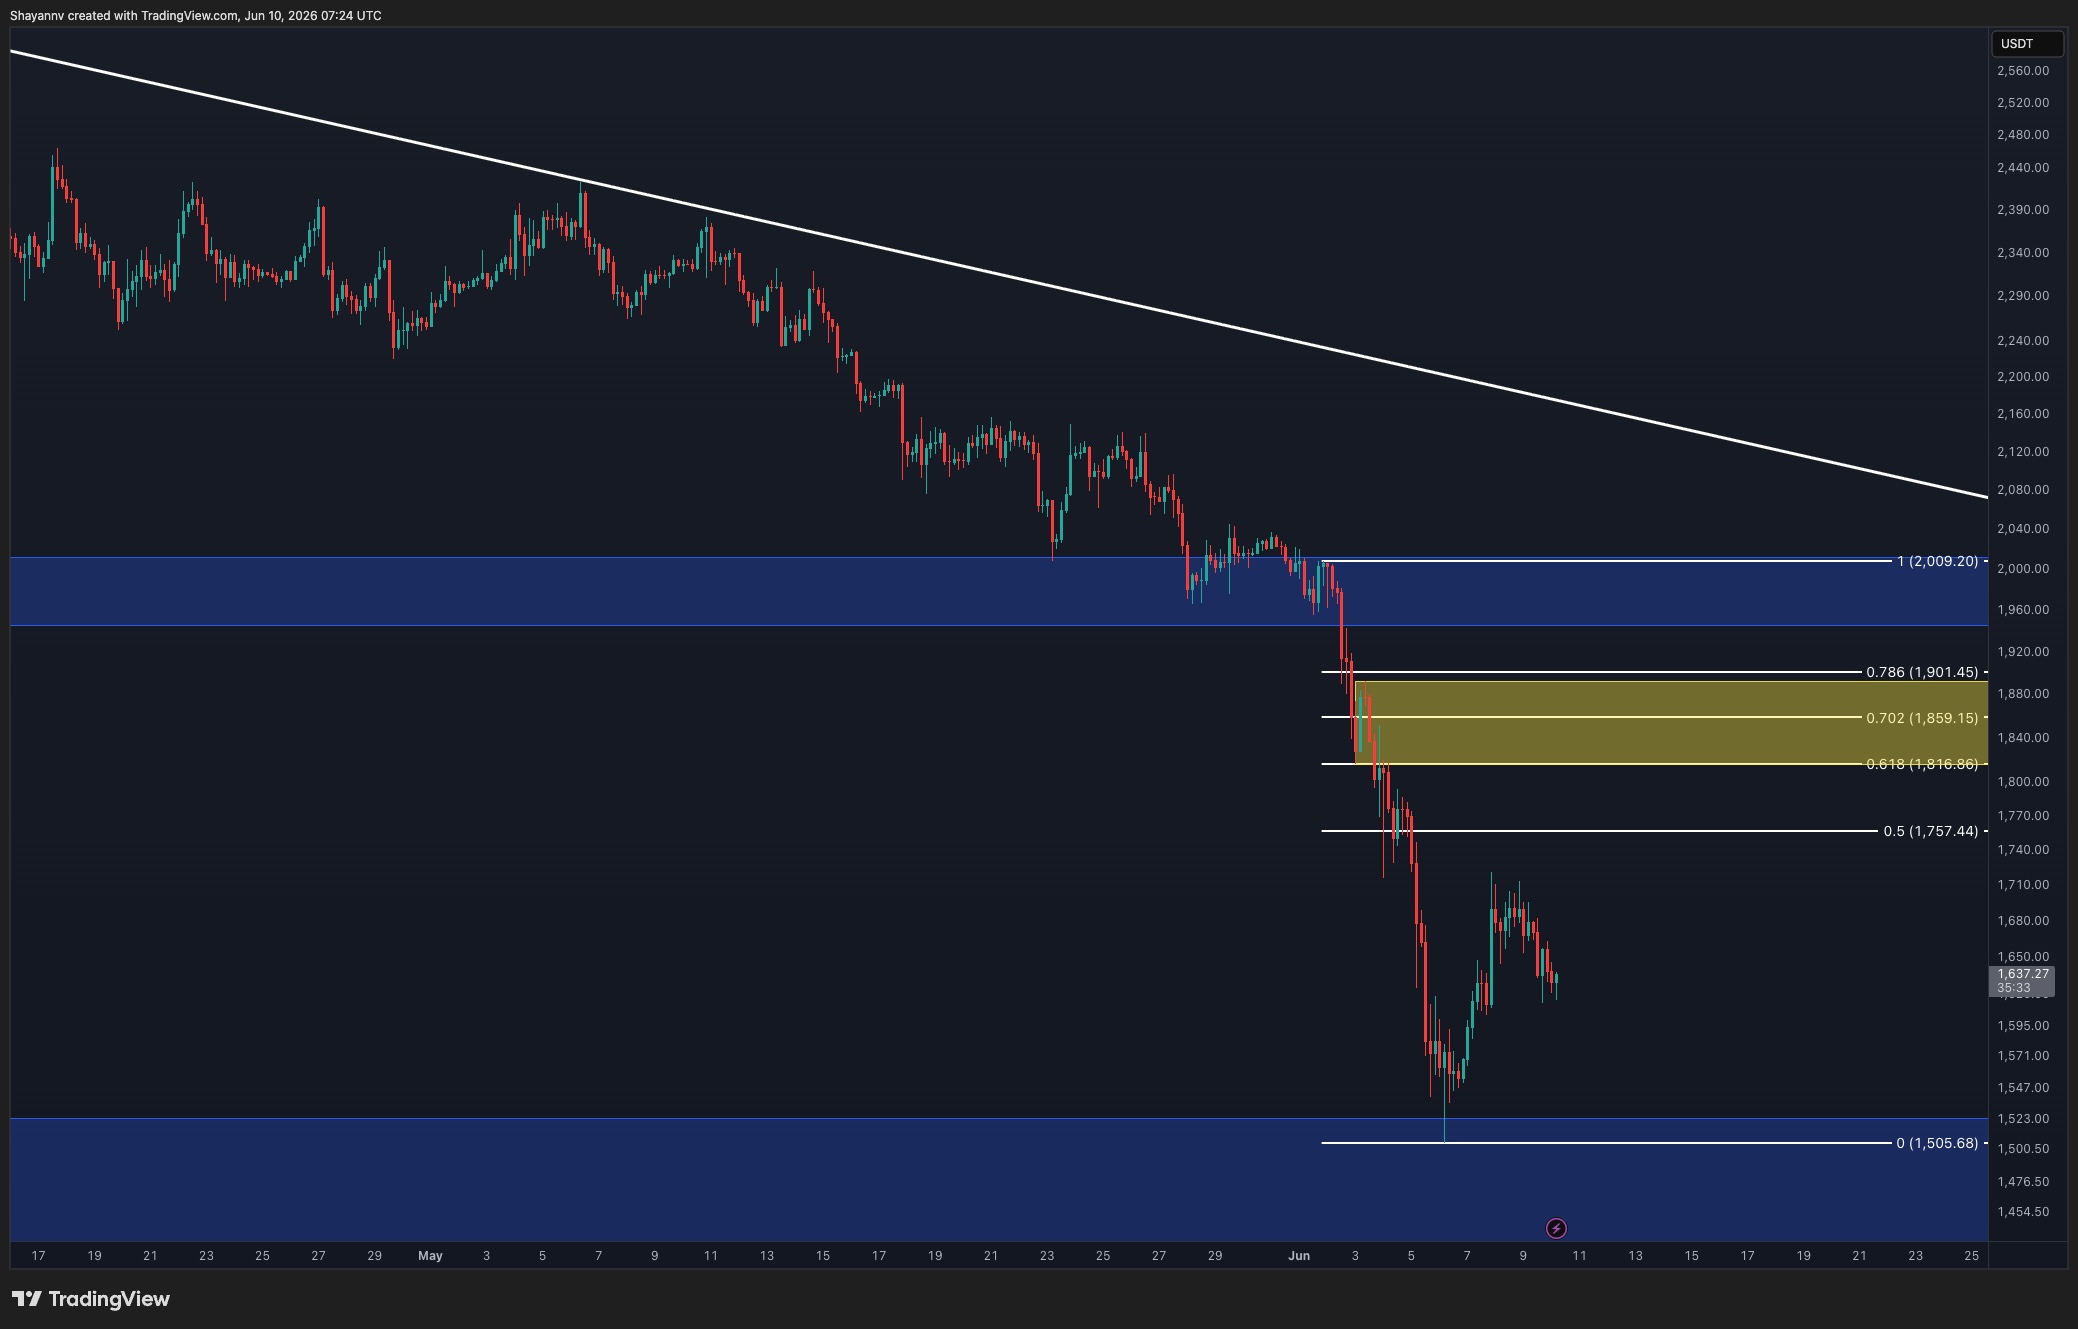
The 4-hour chart provides a clearer view of the recent capitulation and subsequent rebound. After breaking below the $2K support area, ETH experienced an aggressive sell-off that drove the price directly into the lower daily demand zone. The recovery that followed appears corrective so far, with the asset still trading beneath several important Fibonacci retracement levels derived from the latest decline.
The key area to watch is the Fibonacci resistance cluster between $1.82K and $1.9K. This zone contains the 0.618 retracement around $1.82K, the 0.702 level near $1.86K, and the 0.786 retracement around $1.9K. The concentration of these levels creates a notable supply region where sellers may attempt to re-enter the market.
Given the current structure, a continued relief rally toward this Fibonacci cluster appears possible before the next major directional move develops. Such a pullback would also align with the previous breakdown area, making it a technically significant resistance zone.
If ETH is rejected from the $1.82K-$1.9K region, the recent rebound could ultimately prove to be a bearish retest within the broader downtrend. On the other hand, a decisive break above $1.9K would weaken the bearish structure and open the door for a move toward the $2K-$2.05K resistance region.
Sentiment Analysis
The Binance liquidation heatmap highlights a notable concentration of liquidity resting between $1.7K and $1.8K.
This liquidity cluster aligns closely with several technical resistance levels visible on the price charts, including the 0.5 Fibonacci retracement near $1.76K and the lower portion of the broader Fibonacci resistance zone extending toward $1.8K. Such confluence often attracts price action as the market seeks nearby liquidity pools before establishing its next directional move.
From a derivatives perspective, the presence of dense liquidation levels above the current market price suggests that a short-term liquidity-driven squeeze remains possible. A move into the $1.7K-$1.8K area could trigger a wave of liquidations and fuel additional upside momentum toward the higher Fibonacci levels near $1.86K-$1.9K.
As a result, the liquidation profile supports the possibility of a relief rally in the near term, although the broader trend remains bearish until ETH can reclaim the major resistance cluster overhead. The interaction between the $1.7K-$1.8K liquidity pocket and the Fibonacci resistance zone may ultimately determine whether the current rebound evolves into a larger recovery or merely another lower high within the prevailing downtrend.

Disclaimer: The content of this article solely reflects the author's opinion and does not represent the platform in any capacity. This article is not intended to serve as a reference for making investment decisions.
You may also like
Federal Reserve meeting minutes turn "hawkish"! Most officials support another rate hike this year, US dollar continues to rise
The latest minutes released by the Federal Reserve show that all 19 officials support a rate hike in September, and most participants believe that further interest rate increases may still be needed before the end of the year.
High yields on US Treasuries start attracting buyers; $39 billion 10-year Treasury auction sees strong demand as long-end yields give back gains
U.S. Treasury bonds showed mixed performance on Wednesday after a $39 billion 10-year Treasury auction saw strong demand, indicating that as yields reach multi-decade highs, some major investors are starting to re-enter the market.
Overnight U.S. Stocks | Federal Reserve officials expect another rate hike before the end of the year, three major indexes closed lower, Micron Technology (MU.US) rose 4%
At the close, the Dow Jones Industrial Average fell by 341.41 points, down 0.66%, to 51,179.87 points; the S&P 500 Index dropped by 17.20 points, down 0.22%, to 7,801.73 points; and the Nasdaq Composite Index declined by 61.20 points, down 0.22%, to 27,538.69 points.
Federal Reserve meeting minutes: All 19 policymakers support a rate hike in September, but reasons vary; most expect further hikes this year, suggesting no urgency in October.
Most officials view a September interest rate hike as an "insurance" measure against stubborn inflation; a minority see it as a necessary step to curb inflation. Overall, there is no indication of a desire to push for consecutive rate hikes. The "New Fed News Agency" emphasized the minutes: "Most participants believe that it may be appropriate to raise interest rates again before the end of the year." Nearly all officials believe inflation remains elevated and the labor market is close to full employment. Many noted that, despite the rise in long-term U.S. Treasury yields, financial conditions are still conducive to economic growth. Some officials believe that AI will boost investment and productivity, but may also contribute to inflation. The minutes revealed that the U.S.-Japan joint intervention in July to support the yen was a U.S. Treasury action, with no Federal Reserve funds used.
Crypto prices
More


