Bitget App
Trade smarter
Buy cryptoMarketsTradeFuturesStocksEarnInstitutionAI & More
Microsoft Copilot AI Predicts Stunning Gold Price For The Next 90 Days

Microsoft Copilot AI Predicts Stunning Gold Price For The Next 90 Days

CoinspeakerCoinspeaker2026/06/18 14:15
By:Coinspeaker

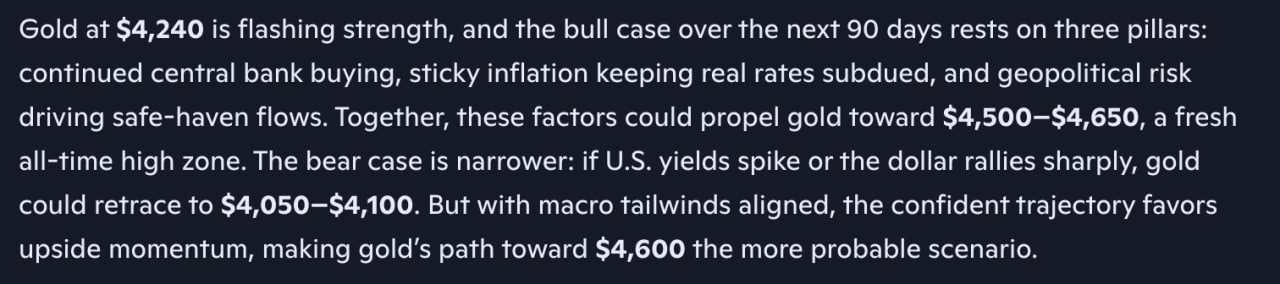
There is a structural choice in how this prediction is built that makes it stand apart from a typical bull case, three pillars, not one. Microsoft Copilot AI is not predicts on a single catalyst doing the heavy lifting. It is stacking continued central bank buying, sticky inflation keeping real rates subdued, and geopolitical risk driving safe-haven flows into a single thesis, the kind of structure where even if one leg weakens, the other two can still carry the trade. That redundancy is part of why the prediction reads with so much confidence despite gold already sitting near record territory.

Over the next 90 days, Copilot targets $4,500 to $4,650 from the current $4,240, a fresh all-time high zone that would represent roughly 6% to 10% upside. That might look modest next to some of the crypto targets in this series, but for an asset class as large and as historically stable as gold, a move of that size inside 90 days is genuinely significant.
Microsoft Copilot AI Predicts Stunning Gold Price For The Next 90 Days image 0

Source: Copilot AI Gold Price Prediction

The thesis does not require gold to discover new utility or attract a wave of speculative capital the way altcoins do. It just requires the three existing pillars to keep doing what they have already been doing throughout this entire cycle.

The bear case is notably narrow, which is informative in itself. If U.S. yields spike or the dollar rallies sharply, gold could retrace to $4,050 to $4,100. There is no mention of demand collapsing or a structural reversal in the safe-haven trade, only a specific macro shock that would need to materialize to derail the move. Copilot’s own conclusion leans hard into that asymmetry, calling the confident trajectory favors upside momentum and naming $4,600 the more probable scenario rather than hedging toward the middle.

Gold Price Prediction: Three Pillars Against One Pullback

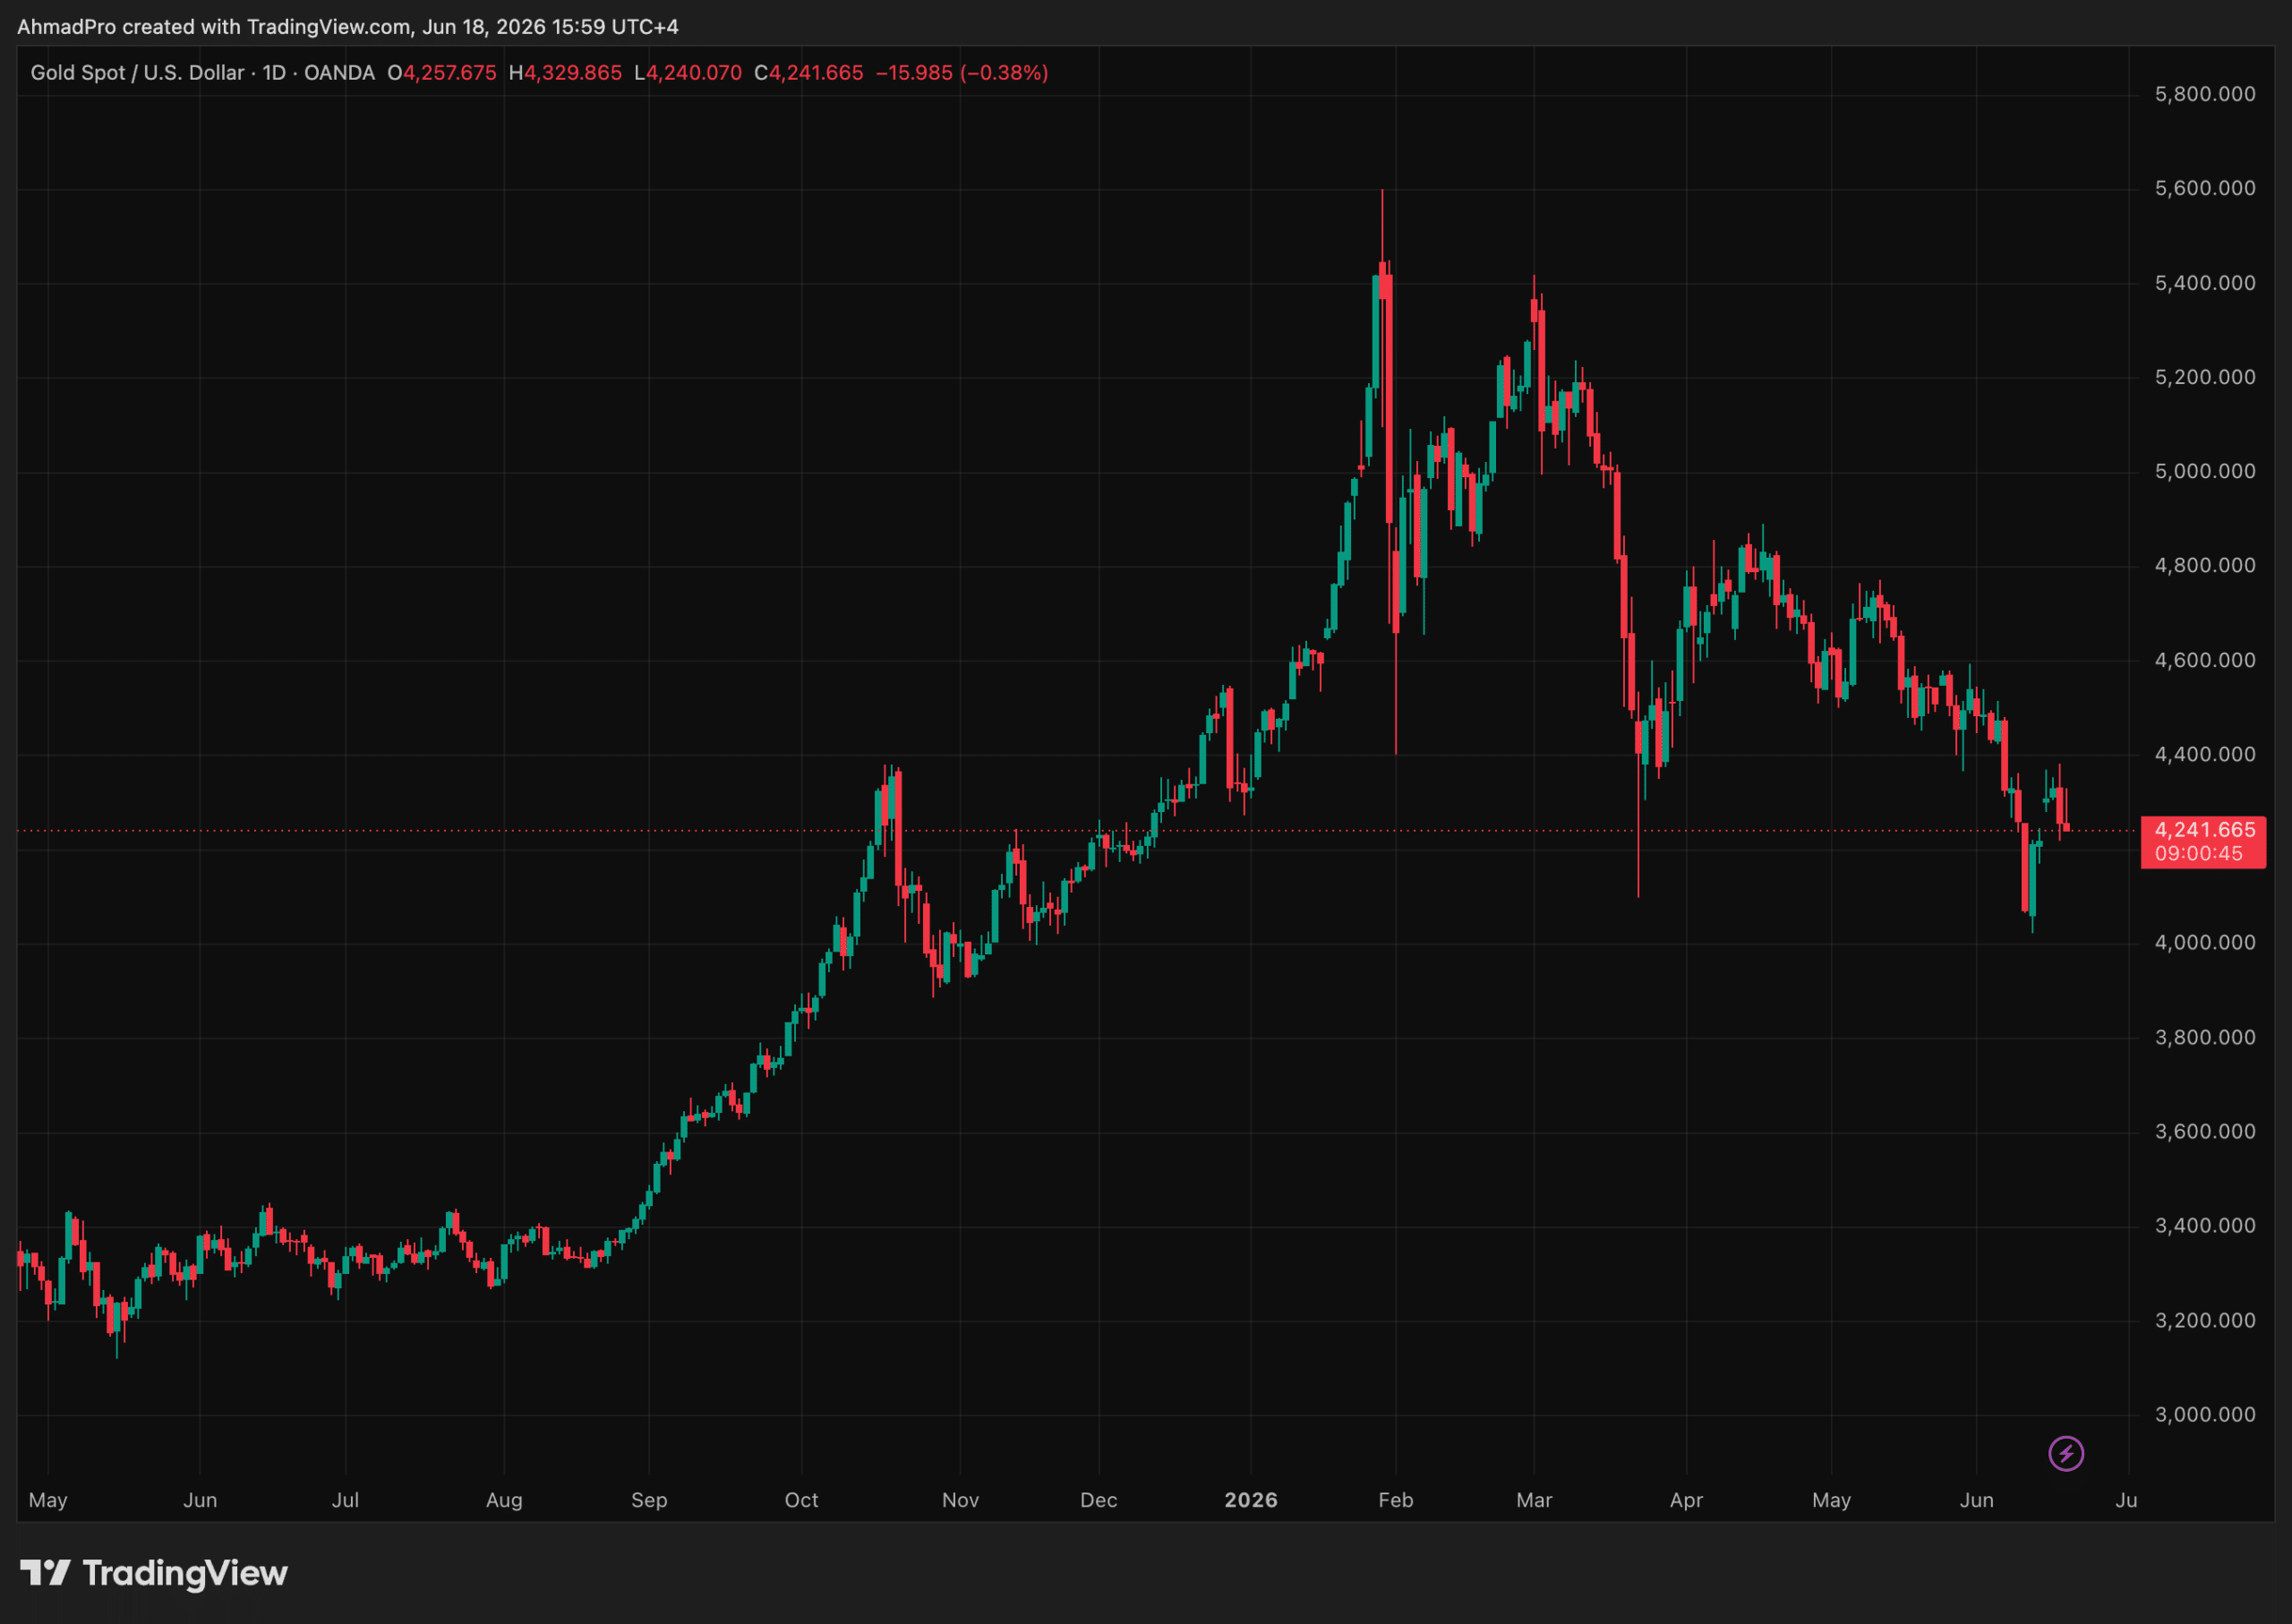
Gold price is at $4,241.125 today, and the daily chart shows an asset that has already delivered one of the most dramatic moves of any market in this entire prediction series, climbing from roughly $3,200 last May to a spike high above $5,600 in late January before correcting hard. That correction is the part of the chart that matters most right now.

Price has spent the past several months grinding lower from that peak in a series of lower highs, but the current level sits almost exactly on top of the broad consolidation zone that built through September and October last year, the same shelf that launched the entire move toward the January high. That repetition gives the $4,200 to $4,250 zone real structural weight as support, not just a number Copilot picked arbitrarily.

The immediate resistance on the way to the bull target sits at $4,400, a level that has rejected price multiple times since April, and clearing it decisively would be the first sign this consolidation is resolving upward rather than continuing to grind sideways or lower.
Microsoft Copilot AI Predicts Stunning Gold Price For The Next 90 Days image 1

Source: Gold Price

Above that, the $4,600 target lines up close to the lower edge of the failed February rally, meaning the bull case is really asking gold to retest territory it has already proven capable of trading at, just from a more stable base this time.

Without RSI data visible on this particular chart, the price structure itself does most of the talking. Gold has corrected nearly 24% from its January spike high while still holding well above every level it traded at before September of last year, which is the technical signature of a deep but contained pullback inside a larger uptrend rather than a trend reversal. Copilot’s three pillars do not need gold to do anything new.

They need the asset to simply resume the trend that defined the entire second half of last year, and the chart’s current position right on top of old support is exactly where that resumption would need to begin.

Here is What Copilot AI Predicts for LiquidChain

Every cycle has a window where the next thing is still cheap enough to matter. That window does not announce itself. Right now, Bitcoin, Ethereum, and XRP are all stuck at the same resistance they have been testing for weeks.

The macro relief is always one inflation print away. The institutional wave is always one quarter away. The upside ceiling for large caps is not hidden. It is right there, visible and priced in, and everyone waiting for a breakout is waiting on a catalyst that belongs to someone else’s balance sheet.

That is not where cycles get won. The asymmetric returns in any cycle come from the gap between what something is genuinely worth and what the market currently thinks it is worth. That gap exists precisely because the project has not been widely discovered yet.

Early-stage infrastructure with a small market cap does not need billions in new capital to move dramatically. It needs to be found. Once it is found, the gap closes, and the opportunity that existed before discovery is gone permanently. 

Cross-chain liquidity has been broken since the first bridge launched, and the industry has never actually fixed it. Bitcoin, Ethereum, and Solana were built as completely independent systems. There is no shared architecture between them, no native interoperability, no design intent for them to function as one. Every transaction that crosses those boundaries absorbs the cost of that decision directly.

Fees extracted before settlement. Slippage is built into every hop. Execution failures at peak congestion. Bridges did not eliminate the problem. They became the infrastructure through which the problem charges its toll. LiquidChain eliminates the toll entirely.

All 3 networks collapse into one execution layer. Single deployment. Full ecosystem reach. No cross-chain tax on any interaction. Copilot AI has flagged it as a project worth watching, and even predicts a huge upside.

Execution is unproven. Adoption is unknown. Established assets offer a smoother ride toward a ceiling that is already fully visible. LiquidChain is an earlier entry point into a problem that has not been solved yet.

Share:
0
0

Disclaimer: The content of this article solely reflects the author's opinion and does not represent the platform in any capacity. This article is not intended to serve as a reference for making investment decisions.

Understand the market, then trade.
Bitget offers one-stop trading for cryptocurrencies, stocks, and gold.
Trade now!

You may also like

ROI - For the Trump-led Treasury, the "tail" of the auction is the most difficult part: McKeever

The views expressed in this article are solely those of the author, Reuters columnist Jamie McGeever. Reuters, Orlando, Florida, October 6 – U.S. Treasury auctions are typically dull, predictable, and not newsworthy. But these are not ordinary times, and the Trump administration now faces the risk of sluggish U.S. debt sales making headlines. The U.S. Treasury plans to issue nearly $120 billion in Treasuries this week, the first non-bill bond sales in two weeks: $58 billion in three-year notes on Tuesday, $39 billion in ten-year notes on Wednesday, and $22 billion in thirty-year bonds on Thursday. These auctions would usually be insignificant events, but due to the exceptionally weak performance of auctions from September 22 to 24—especially the five-year note auction on September 23, which triggered the largest spike in bond yields since April last year—they are attracting growing attention. Since then, yields have not only failed to retreat but have surged across most tenors to multi-decade highs. It's worth noting that the possibility of a U.S. Treasury auction "failing" is almost zero. Primary dealers—currently 26 Wall Street banks and institutions authorized by the New York Fed as market makers for Treasuries—are always involved. They effectively underwrite the sales, ensuring the smooth operation of the $30 trillion U.S. Treasury market, the most liquid market in the world. This, in turn, allows the entire global financial system to function, given that trillions of dollars in global debt, assets, and market derivatives are benchmarked against U.S. Treasuries. Treasuries are also the primary collateral for lubricating the financial “pipes” of the U.S. and global markets, including repo agreements, interbank loans, and financing. In short, as long as U.S. Treasuries remain the pillar of the global financial system, there will always be buyers at Treasury auctions. The question, as always, is at what price these bonds will be sold. Currently, borrowing costs in the secondary market are at their highest levels since the mid-2000s, so it's reasonable to expect that the Treasury will pay relatively high rates in the primary market as well. But as recent auctions have shown, negative surprises remain possible. "Too big to be absorbed by the market"? The $70 billion five-year auction on September 23 was among the most worrisome in years. Demand, as measured by the bid-to-cover ratio, was at a nine-year low. The Treasury ended up selling the notes at a yield of 5.033%, more than 3 basis points above the market yield at the close of bidding. Three basis points might not sound like much, but it's exceptional for a five-year note auction. This is the largest so-called "tail" since June 2022. According to JPMorgan analysts, the last time a five-year auction had a three-basis-point tail was back in 2011—amid the brewing debt ceiling crisis that eventually led to a U.S. credit rating downgrade in August that year. Currently, concerns over the U.S.'s daunting fiscal outlook are driving up long-term borrowing costs. As a result, markets generally expect the Trump administration to gradually shift the Treasury’s massive funding needs toward the lower-yield (and therefore lower-cost) short- and medium-term segments of the curve. That's why the five-year note auction two weeks ago sparked such concern. A three-basis-point tail is common in long bond auctions, but not in the "belly" of the yield curve. If the Treasury is forced to pay a higher premium to issue these bonds, then Houston, we have a problem. A large auction tail can be caused by many factors, including market volatility on the day of the auction or more concerning, fundamental issues that may erode demand over time. The two are often hard to distinguish because they are not mutually exclusive. On a brighter note, this unease has not yet spread to the short end of the yield curve. At least, not yet. Three-year and ten-year Treasury yields are up about 50 basis points from the last auction a month ago, hovering around 4.96% and 5.32%, respectively. The thirty-year yield is up roughly 35 basis points to 5.65%. These levels should be high enough to attract strong demand and ensure smooth sales, right? Maybe. But if surprises do occur, volatility and uncertainty could spill over across the market. Investors will be watching developments as closely as hawks. (The views in this article are solely those of the author, a Reuters columnist.) Like this column? Check out Reuters' "Unhedged" (ROI), your essential new source for global finance commentary. Follow ROI on LinkedIn and X. You can also listen to the daily "Morning Bid" podcast on Apple, Spotify, or the Reuters app—subscribe for in-depth market and finance news, seven days a week. US 5-year auction has biggest 'tail' since 2022 https://fingfx.thomsonreuters.com/gfx/mkt/dwpkmkzogpm/TAIL.png (For the convenience of non-English speakers, Reuters provides automated translations of its reports

路透社•2026/10/06 13:11

Money market fund inflows plummet to 158 billion—Is short-term US Treasury liquidity flashing a warning sign?

Money market fund inflows have sharply dropped to $158 billion in the first three quarters of this year, driving Treasury yields higher. Increased volatility at the short end has raised market concerns about tightening short-term financing.

智通财经•2026/10/06 13:07