
Hyperliquid double top threatens deeper pullback as HYPE loses 13% from ATH

Hyperliquid has retreated more than 13% from its record high after a wave of profit-taking hit HYPE, while traders assess whether a newly formed double-top pattern could trigger a deeper correction.
- HYPE has dropped more than 12% from its $76.70 all-time high as profit-taking accelerates.
- A double-top pattern on the 4-hour chart puts key support levels near $65 and $62 in focus.
- Liquidation clusters between $70 and $72 could fuel volatility as traders battle for direction.
According to data from crypto.news, Hyperliquid (HYPE) price fell to an intraday low near $65.7 on June 19, extending losses from its June 16 all-time high of $76.70.
The pullback followed one of the strongest rallies in crypto this month, fueled by heavy derivatives activity, a short squeeze, and enthusiasm surrounding tokenized SpaceX exposure on the Hyperliquid ecosystem.
The decline has unfolded alongside a risk-off move across digital assets after Federal Reserve Chair Kevin Warsh reinforced a hawkish policy stance during his first meeting at the helm of the U.S. central bank. Higher-for-longer rate expectations strengthened the dollar and pressured speculative assets, prompting traders to reduce exposure across altcoins.
Additional pressure came from Hyperliquid’s recent token unlock. Earlier this month, roughly 9.9 million HYPE tokens entered circulation as part of a scheduled vesting event worth about $700 million at prevailing prices. Although Hyperliquid’s fee-funded buyback mechanism helped absorb much of that supply during the rally, the market has become more sensitive to any slowdown in trading activity.
Network activity remains elevated by historical standards, but perpetual trading volume has eased from the peak levels recorded during HYPE’s surge toward $77. With fewer buyback-driven purchases entering the market, short-term traders have become more willing to lock in gains after the token’s rapid ascent.
Double-top pattern puts key support levels in focus
The four-hour chart shows HYPE carving out a clear double top near the $76.70-$77 region, a pattern that often appears near local market peaks. HYPE has already broken below the 0.618 Fibonacci retracement level around $67.7 and is testing support between $64.8 and $65.
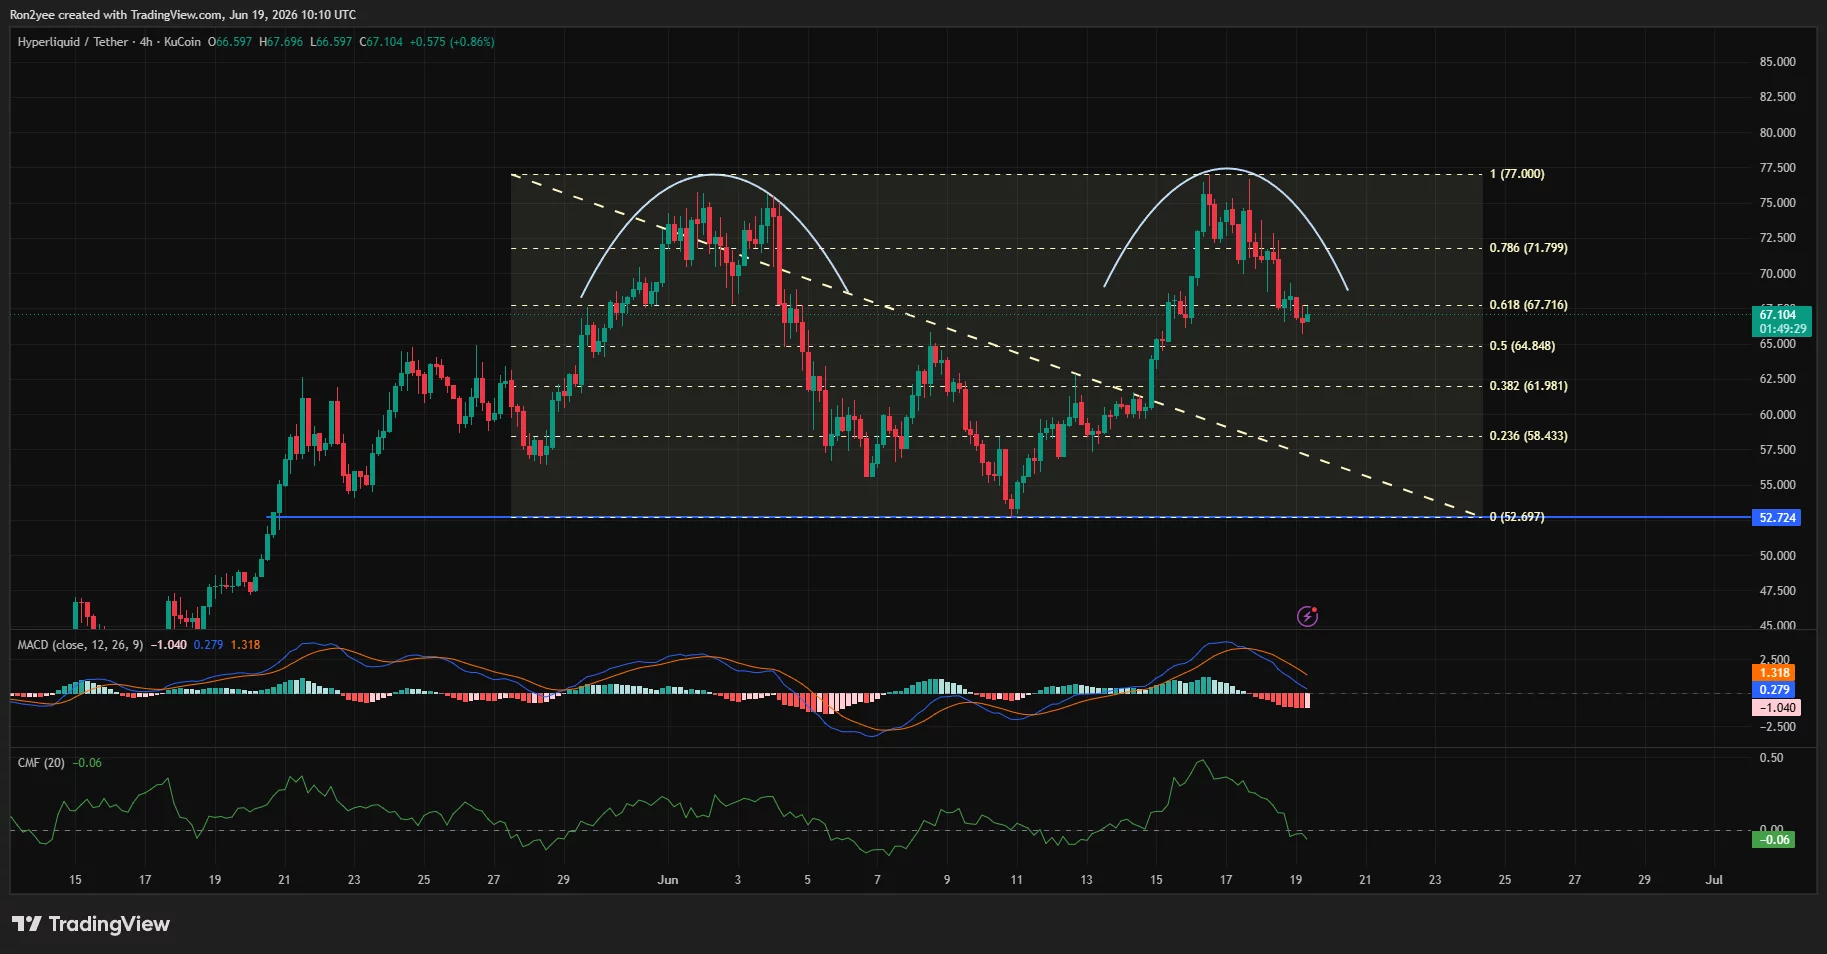 Hyperliquid price is forming a double top pattern on the 4-hour chart — June 19 | Source:
crypto.news
Hyperliquid price is forming a double top pattern on the 4-hour chart — June 19 | Source:
crypto.news
A decisive break beneath the $64.8 neckline area would strengthen the bearish setup and increase the probability of a move toward the next Fibonacci support near $62, followed by the $58.4 region. The measured target derived from the double-top structure also aligns with a potential decline toward the upper-$50 range.
Momentum indicators have weakened. On the four-hour chart, the MACD has crossed lower and remains below its signal line, while Chaikin Money Flow has slipped into negative territory at approximately -0.06, suggesting capital has been leaving the asset during the recent selloff.
The daily chart presents a mixed picture. HYPE continues to trade above major support near $56.5, but price remains below the daily Supertrend resistance at roughly $74.3. Bulls would need to reclaim the $70-$72 zone to invalidate the immediate bearish structure and reopen the path toward the recent highs.
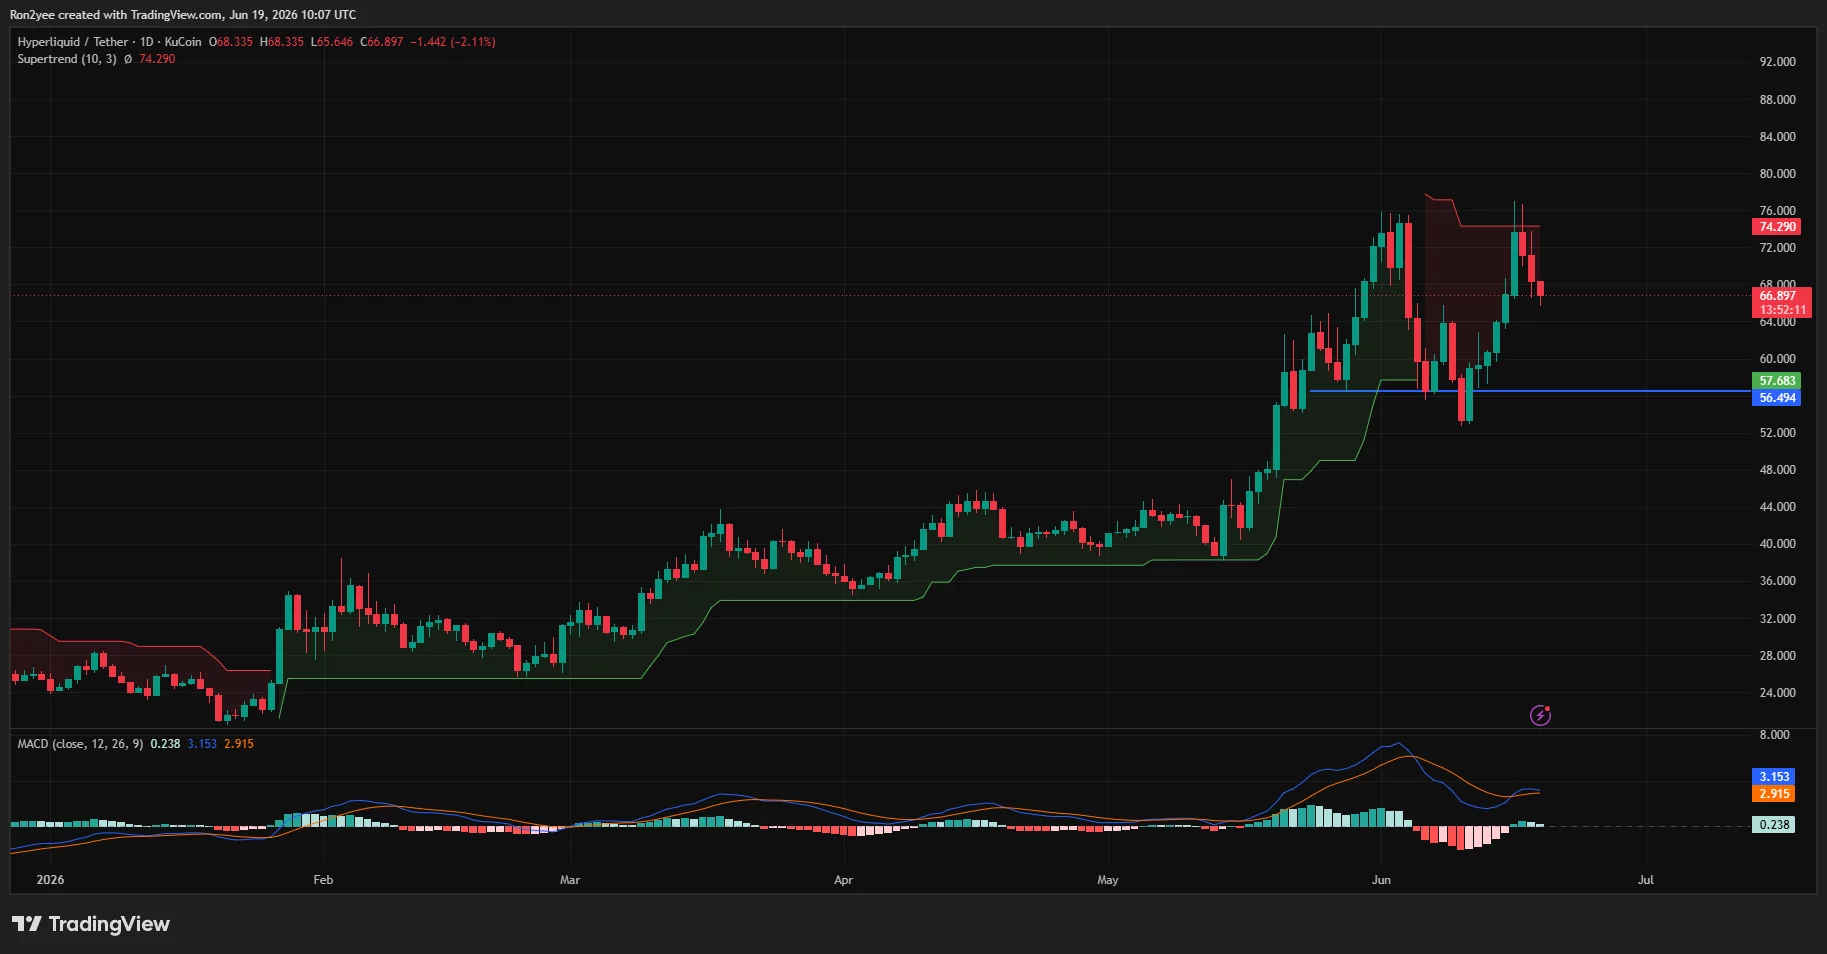 Hyperliquid daily price chart — June 19 | Source:
crypto.news
Hyperliquid daily price chart — June 19 | Source:
crypto.news
Liquidation clusters create battleground between $70 and $72
CoinGlass liquidation heatmap data shows a dense concentration of leveraged positions between $69.5 and $72. Strong liquidation bands are clustered around $70 and $71.8, creating a magnet zone if buyers regain control.
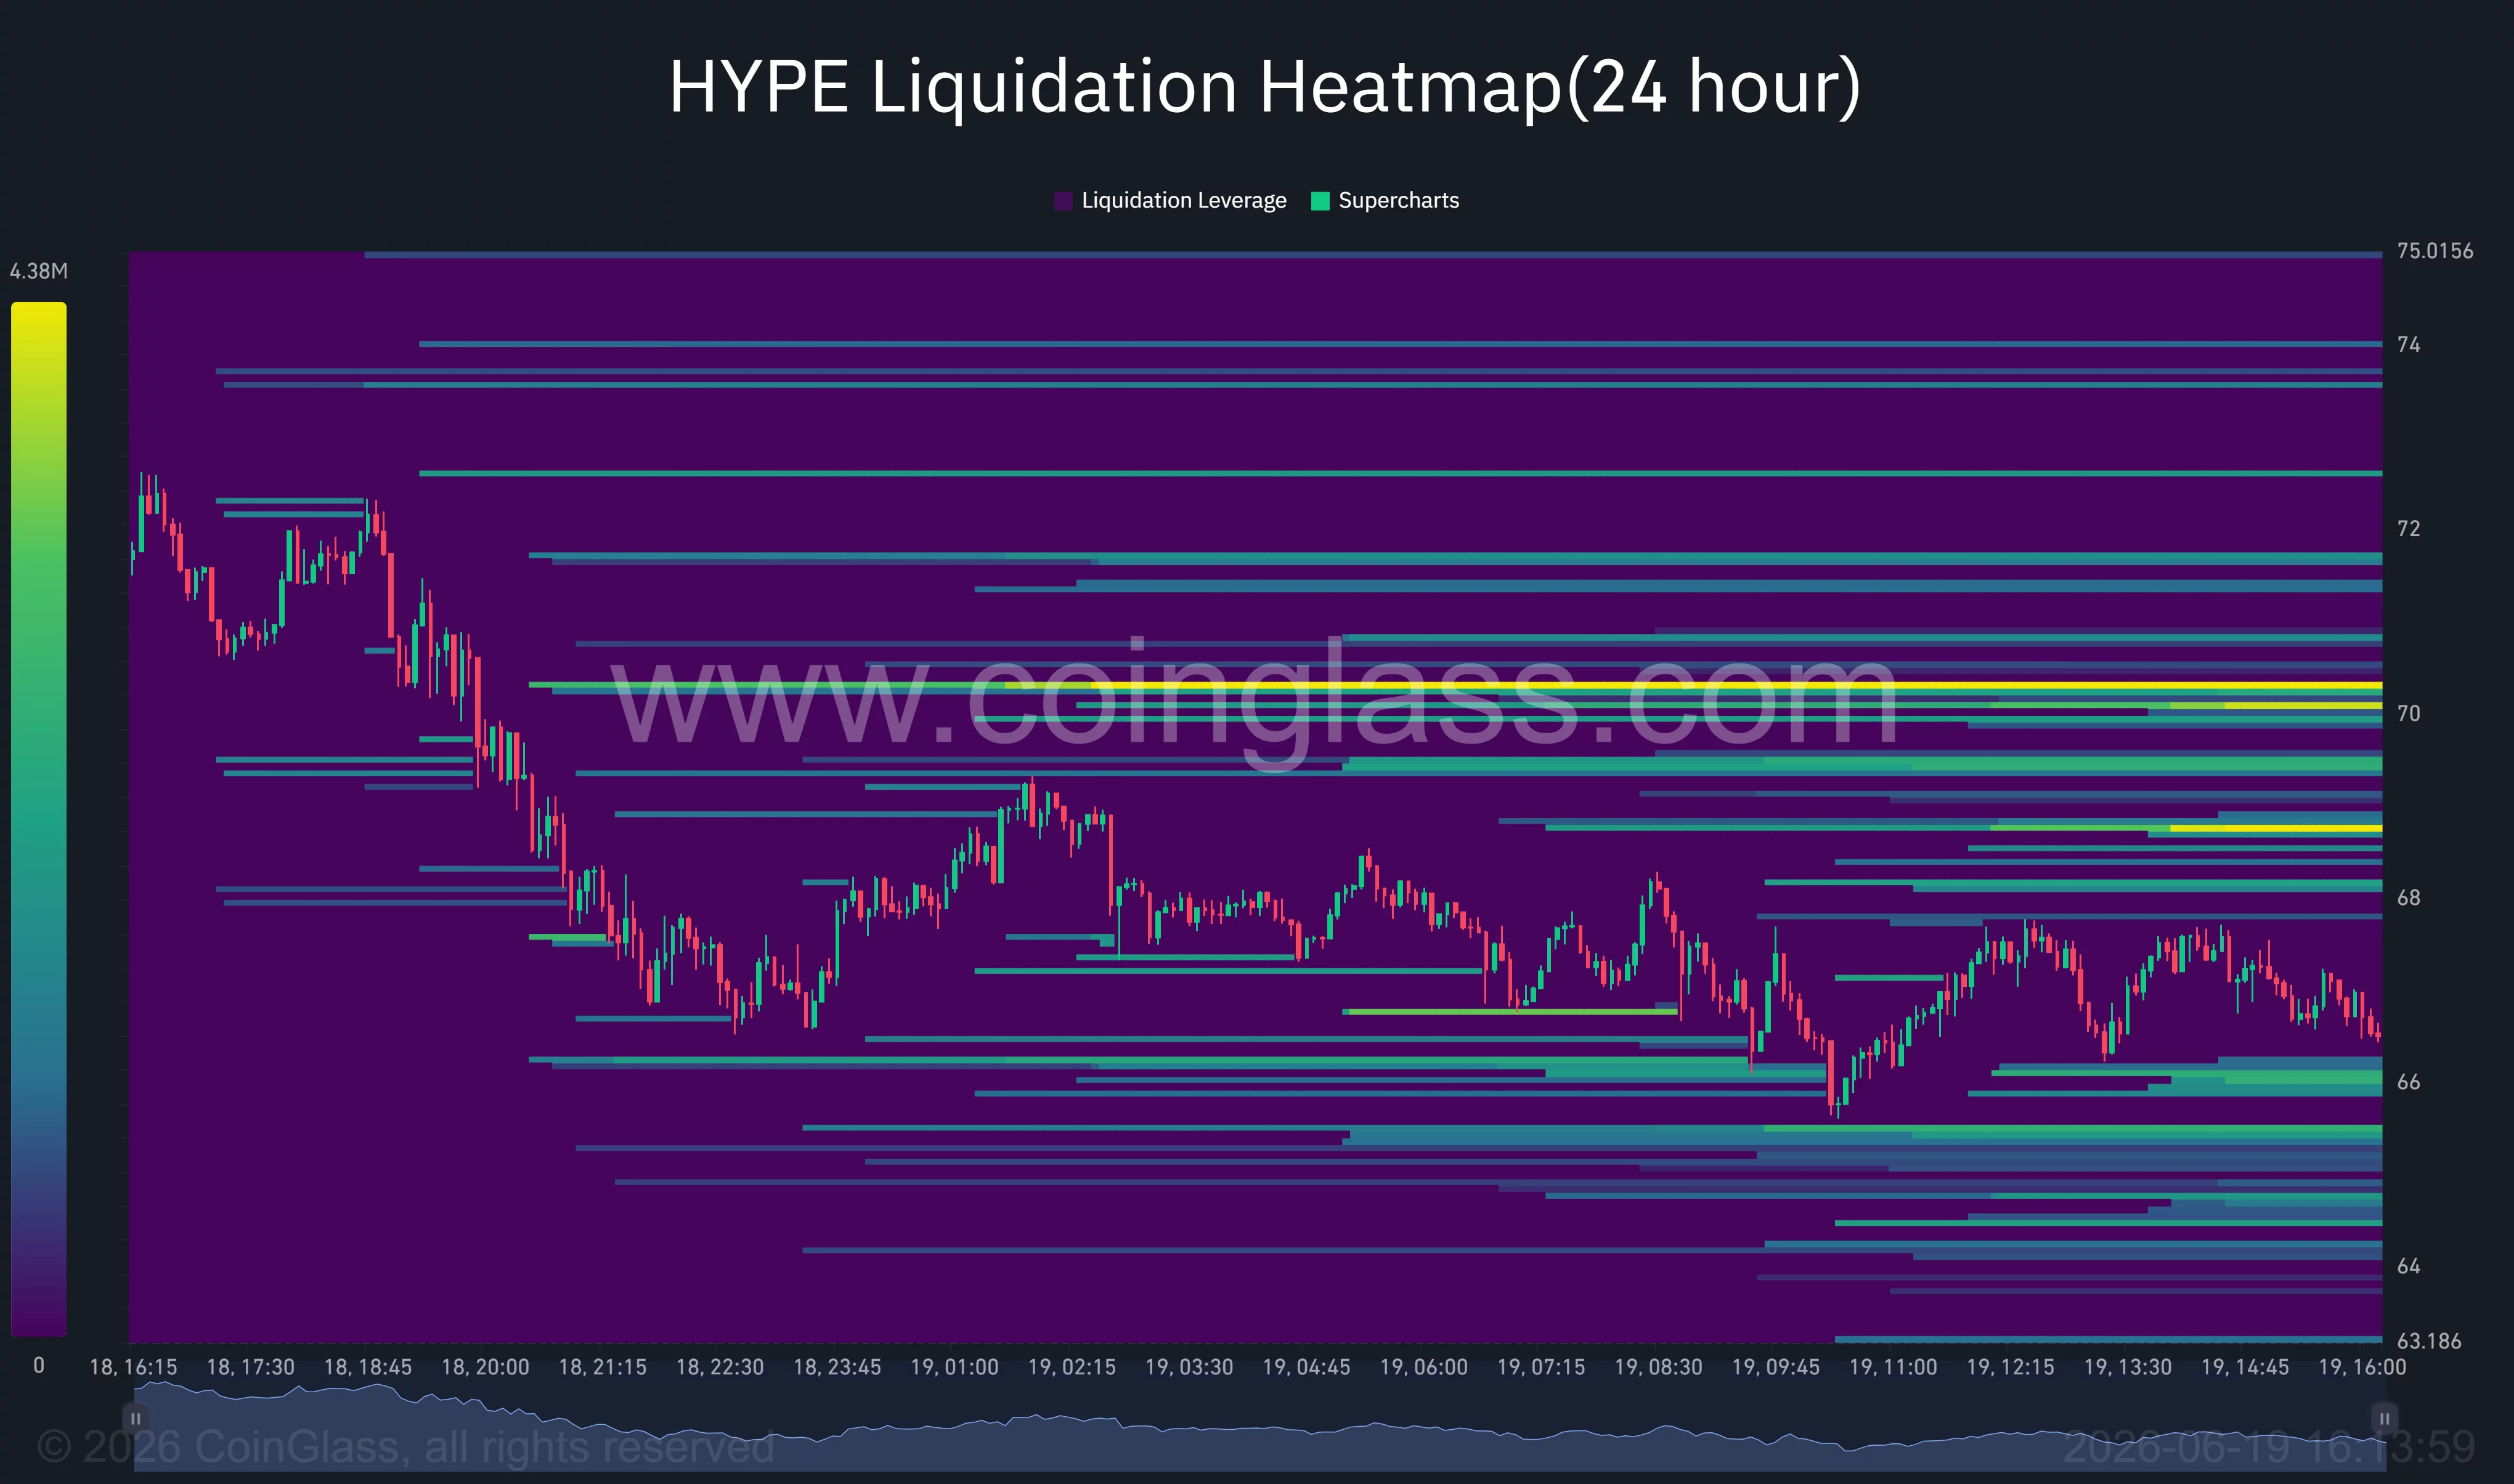 Hyperliquid liquidation heatmap | Source:
CoinGlass
Hyperliquid liquidation heatmap | Source:
CoinGlass
Meanwhile, sizeable liquidity pockets have formed below the market around $65 and $64. A breakdown into those levels could trigger another round of long liquidations and accelerate downside volatility.
According to analyst Lennaert Snyder, Bitcoin recently swept liquidity around $62,300 and may seek lower levels before establishing a durable bottom. While Snyder’s comments focused on Bitcoin, continued weakness in the market leader could add pressure across high-beta assets such as HYPE.
A recovery in crypto sentiment, renewed derivatives activity, and a move back above $70 would improve HYPE’s outlook. Until then, traders remain focused on whether the double-top breakdown extends toward the mid-$50 support zone or stabilizes before a larger trend reversal develops.
Disclaimer: The content of this article solely reflects the author's opinion and does not represent the platform in any capacity. This article is not intended to serve as a reference for making investment decisions.
You may also like
ROI - For the Trump-led Treasury, the "tail" of the auction is the most difficult part: McKeever
The views expressed in this article are solely those of the author, Reuters columnist Jamie McGeever. Reuters, Orlando, Florida, October 6 – U.S. Treasury auctions are typically dull, predictable, and not newsworthy. But these are not ordinary times, and the Trump administration now faces the risk of sluggish U.S. debt sales making headlines. The U.S. Treasury plans to issue nearly $120 billion in Treasuries this week, the first non-bill bond sales in two weeks: $58 billion in three-year notes on Tuesday, $39 billion in ten-year notes on Wednesday, and $22 billion in thirty-year bonds on Thursday. These auctions would usually be insignificant events, but due to the exceptionally weak performance of auctions from September 22 to 24—especially the five-year note auction on September 23, which triggered the largest spike in bond yields since April last year—they are attracting growing attention. Since then, yields have not only failed to retreat but have surged across most tenors to multi-decade highs. It's worth noting that the possibility of a U.S. Treasury auction "failing" is almost zero. Primary dealers—currently 26 Wall Street banks and institutions authorized by the New York Fed as market makers for Treasuries—are always involved. They effectively underwrite the sales, ensuring the smooth operation of the $30 trillion U.S. Treasury market, the most liquid market in the world. This, in turn, allows the entire global financial system to function, given that trillions of dollars in global debt, assets, and market derivatives are benchmarked against U.S. Treasuries. Treasuries are also the primary collateral for lubricating the financial “pipes” of the U.S. and global markets, including repo agreements, interbank loans, and financing. In short, as long as U.S. Treasuries remain the pillar of the global financial system, there will always be buyers at Treasury auctions. The question, as always, is at what price these bonds will be sold. Currently, borrowing costs in the secondary market are at their highest levels since the mid-2000s, so it's reasonable to expect that the Treasury will pay relatively high rates in the primary market as well. But as recent auctions have shown, negative surprises remain possible. "Too big to be absorbed by the market"? The $70 billion five-year auction on September 23 was among the most worrisome in years. Demand, as measured by the bid-to-cover ratio, was at a nine-year low. The Treasury ended up selling the notes at a yield of 5.033%, more than 3 basis points above the market yield at the close of bidding. Three basis points might not sound like much, but it's exceptional for a five-year note auction. This is the largest so-called "tail" since June 2022. According to JPMorgan analysts, the last time a five-year auction had a three-basis-point tail was back in 2011—amid the brewing debt ceiling crisis that eventually led to a U.S. credit rating downgrade in August that year. Currently, concerns over the U.S.'s daunting fiscal outlook are driving up long-term borrowing costs. As a result, markets generally expect the Trump administration to gradually shift the Treasury’s massive funding needs toward the lower-yield (and therefore lower-cost) short- and medium-term segments of the curve. That's why the five-year note auction two weeks ago sparked such concern. A three-basis-point tail is common in long bond auctions, but not in the "belly" of the yield curve. If the Treasury is forced to pay a higher premium to issue these bonds, then Houston, we have a problem. A large auction tail can be caused by many factors, including market volatility on the day of the auction or more concerning, fundamental issues that may erode demand over time. The two are often hard to distinguish because they are not mutually exclusive. On a brighter note, this unease has not yet spread to the short end of the yield curve. At least, not yet. Three-year and ten-year Treasury yields are up about 50 basis points from the last auction a month ago, hovering around 4.96% and 5.32%, respectively. The thirty-year yield is up roughly 35 basis points to 5.65%. These levels should be high enough to attract strong demand and ensure smooth sales, right? Maybe. But if surprises do occur, volatility and uncertainty could spill over across the market. Investors will be watching developments as closely as hawks. (The views in this article are solely those of the author, a Reuters columnist.) Like this column? Check out Reuters' "Unhedged" (ROI), your essential new source for global finance commentary. Follow ROI on LinkedIn and X. You can also listen to the daily "Morning Bid" podcast on Apple, Spotify, or the Reuters app—subscribe for in-depth market and finance news, seven days a week. US 5-year auction has biggest 'tail' since 2022 https://fingfx.thomsonreuters.com/gfx/mkt/dwpkmkzogpm/TAIL.png (For the convenience of non-English speakers, Reuters provides automated translations of its reports
Money market fund inflows plummet to 158 billion—Is short-term US Treasury liquidity flashing a warning sign?
Money market fund inflows have sharply dropped to $158 billion in the first three quarters of this year, driving Treasury yields higher. Increased volatility at the short end has raised market concerns about tightening short-term financing.
Crypto prices
More


