Bitget App
Trade smarter
Buy cryptoMarketsTradeFuturesStocksEarnInstitutionAI & More
Pi Network Price Prediction: PI Stays Weak as 127M Token Unlock Nears

Pi Network Price Prediction: PI Stays Weak as 127M Token Unlock Nears

CoinEditionCoinEdition2026/06/19 12:33
By:CoinEdition

Pi Network (PI) continues to face market pressure as traders monitor price weakness, upcoming token unlocks, and ecosystem developments. The PI/USDT daily chart shows a prolonged bearish phase, with sellers maintaining control after the strong rally recorded in March. 

Besides the price decline, new supply entering the market and ongoing ecosystem upgrades remain important factors influencing sentiment. The network is also preparing for Pi2Day activities, which could increase attention around its growing application ecosystem.

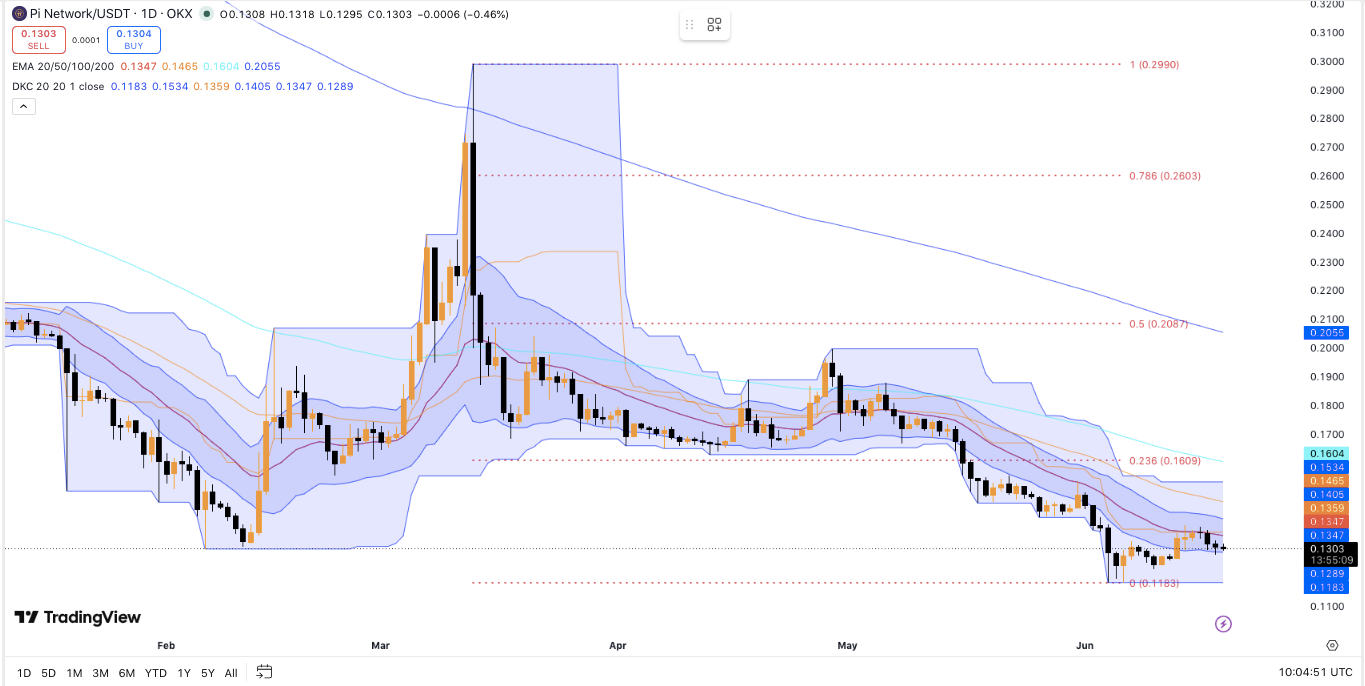
The daily structure shows PI trading inside a descending trend pattern. The token has formed lower highs and lower lows since reaching the March peak near the $0.28 to $0.30 area. Consequently, recent rebounds appear limited and have failed to confirm a trend reversal.

Pi’s current market position remains below key exponential moving averages. The EMA 20, EMA 50, EMA 100, and EMA 200 all sit above the current price. Moreover, the moving averages maintain a bearish alignment, signaling continued weakness.

The Ichimoku cloud also reflects caution. PI trades below the cloud, which acts as resistance during recovery attempts. Hence, buyers need stronger momentum before the market can shift into a bullish phase.
Pi Network Price Prediction: PI Stays Weak as 127M Token Unlock Nears image 0

Fibonacci levels highlight several important areas. The 0.236 retracement level around $0.1609 remains the first major resistance. A move above this zone could open room toward $0.18 to $0.19. However, the $0.208 area remains a key level that could confirm a larger trend change.

Related: Re (RE) Price Prediction: Technicals Flash Mixed Signals — What’s Next?

On the downside, PI currently depends on the $0.128 to $0.130 support range. A failure to defend this zone could expose the token to the $0.118 to $0.120 region. Below this level, sellers may attempt to push the price toward fresh lows.

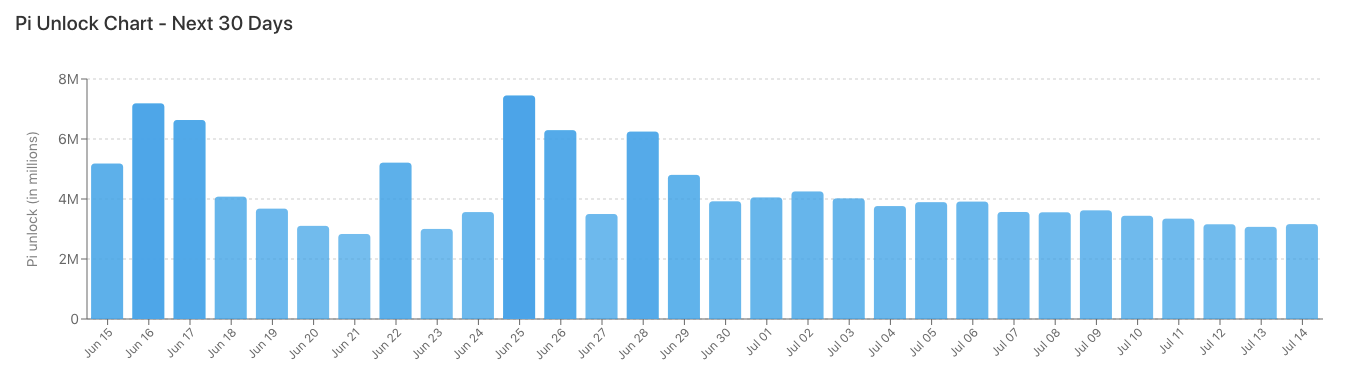
Token supply remains another factor affecting PI’s market outlook. Around 6.21 billion locked PI tokens are tracked, with approximately 127.5 million PI expected to unlock within 30 days. This represents about 2.05% of the locked supply.
Pi Network Price Prediction: PI Stays Weak as 127M Token Unlock Nears image 1 Source:

The average daily unlock rate stands near 4.25 million PI. Additionally, the largest daily release arrives on June 25, with about 7.45 million PI becoming available. These unlock events may increase market supply if holders decide to sell.

Meanwhile, Pi Network continues improving its ecosystem tools. The updated Ecosystem Directory Staking design aims to improve app discovery before Pi2Day on June 28.

Related: XRP Price Prediction: 30M XRP Left Whale Wallets as Active Addresses Crash 50%

The feature allows users to support applications by staking PI. It helps developers gain visibility across the Pi ecosystem. Significantly, the system focuses on discovery rather than staking rewards.

Pi Network price action remains firmly within a bearish market structure heading into the current trading cycle. Key levels are clearly defined as the token continues to trade below major moving averages and within a descending channel. 

Upside levels: $0.135, $0.145, and $0.1609 act as immediate resistance barriers where selling pressure has repeatedly emerged. A stronger breakout could extend gains toward $0.180 and $0.190, with $0.208 marking a critical reversal threshold for medium-term bullish momentum.

Downside levels: $0.128 serves as immediate support, followed by $0.120 as a deeper structural cushion. A breakdown below $0.120 risks accelerating bearish continuation toward new local lows. These zones remain essential in maintaining short-term stability as volatility compresses near the lower range of the structure.

Resistance ceiling: The $0.1609 Fibonacci retracement aligns closely with EMA clusters, making it the key level to flip for early bullish confirmation. Additionally, the broader EMA 200 zone above current price reinforces strong overhead resistance, limiting recovery attempts and maintaining a bearish bias on the daily timeframe.

The technical picture suggests PI is compressing within a descending structure, where repeated lower highs indicate sustained seller control. However, tightening price action near support signals potential volatility expansion in the coming sessions, depending on breakout direction.

Pi Network price direction hinges on whether buyers can defend the $0.128 support zone long enough to build momentum toward the $0.145–$0.160 resistance cluster. Technical compression and repeated rejection from EMA resistance suggest the market remains in distribution mode rather than accumulation.

If bullish momentum strengthens alongside improved inflows, PI could retest $0.180 and potentially challenge $0.208, which would confirm a broader trend shift. However, failure to hold $0.128 increases downside exposure toward $0.120 and risks extending the bearish cycle.

Related: Cardano Price Prediction: Calls Grow to Remove Hoskinson as ADA Tests a Familiar Bounce Zone

For now, Pi Network remains in a critical decision zone. Market participants continue to watch for confirmation signals, while price structure dictates that only a clean break above $0.1609 would shift sentiment meaningfully toward recovery.

div#ce-iframe-ads div#frame { margin: auto; text-align: center; }
0
0

Disclaimer: The content of this article solely reflects the author's opinion and does not represent the platform in any capacity. This article is not intended to serve as a reference for making investment decisions.

Understand the market, then trade.
Bitget offers one-stop trading for cryptocurrencies, stocks, and gold.
Trade now!

You may also like

ROI - For the Trump-led Treasury, the "tail" of the auction is the most difficult part: McKeever

The views expressed in this article are solely those of the author, Reuters columnist Jamie McGeever. Reuters, Orlando, Florida, October 6 – U.S. Treasury auctions are typically dull, predictable, and not newsworthy. But these are not ordinary times, and the Trump administration now faces the risk of sluggish U.S. debt sales making headlines. The U.S. Treasury plans to issue nearly $120 billion in Treasuries this week, the first non-bill bond sales in two weeks: $58 billion in three-year notes on Tuesday, $39 billion in ten-year notes on Wednesday, and $22 billion in thirty-year bonds on Thursday. These auctions would usually be insignificant events, but due to the exceptionally weak performance of auctions from September 22 to 24—especially the five-year note auction on September 23, which triggered the largest spike in bond yields since April last year—they are attracting growing attention. Since then, yields have not only failed to retreat but have surged across most tenors to multi-decade highs. It's worth noting that the possibility of a U.S. Treasury auction "failing" is almost zero. Primary dealers—currently 26 Wall Street banks and institutions authorized by the New York Fed as market makers for Treasuries—are always involved. They effectively underwrite the sales, ensuring the smooth operation of the $30 trillion U.S. Treasury market, the most liquid market in the world. This, in turn, allows the entire global financial system to function, given that trillions of dollars in global debt, assets, and market derivatives are benchmarked against U.S. Treasuries. Treasuries are also the primary collateral for lubricating the financial “pipes” of the U.S. and global markets, including repo agreements, interbank loans, and financing. In short, as long as U.S. Treasuries remain the pillar of the global financial system, there will always be buyers at Treasury auctions. The question, as always, is at what price these bonds will be sold. Currently, borrowing costs in the secondary market are at their highest levels since the mid-2000s, so it's reasonable to expect that the Treasury will pay relatively high rates in the primary market as well. But as recent auctions have shown, negative surprises remain possible. "Too big to be absorbed by the market"? The $70 billion five-year auction on September 23 was among the most worrisome in years. Demand, as measured by the bid-to-cover ratio, was at a nine-year low. The Treasury ended up selling the notes at a yield of 5.033%, more than 3 basis points above the market yield at the close of bidding. Three basis points might not sound like much, but it's exceptional for a five-year note auction. This is the largest so-called "tail" since June 2022. According to JPMorgan analysts, the last time a five-year auction had a three-basis-point tail was back in 2011—amid the brewing debt ceiling crisis that eventually led to a U.S. credit rating downgrade in August that year. Currently, concerns over the U.S.'s daunting fiscal outlook are driving up long-term borrowing costs. As a result, markets generally expect the Trump administration to gradually shift the Treasury’s massive funding needs toward the lower-yield (and therefore lower-cost) short- and medium-term segments of the curve. That's why the five-year note auction two weeks ago sparked such concern. A three-basis-point tail is common in long bond auctions, but not in the "belly" of the yield curve. If the Treasury is forced to pay a higher premium to issue these bonds, then Houston, we have a problem. A large auction tail can be caused by many factors, including market volatility on the day of the auction or more concerning, fundamental issues that may erode demand over time. The two are often hard to distinguish because they are not mutually exclusive. On a brighter note, this unease has not yet spread to the short end of the yield curve. At least, not yet. Three-year and ten-year Treasury yields are up about 50 basis points from the last auction a month ago, hovering around 4.96% and 5.32%, respectively. The thirty-year yield is up roughly 35 basis points to 5.65%. These levels should be high enough to attract strong demand and ensure smooth sales, right? Maybe. But if surprises do occur, volatility and uncertainty could spill over across the market. Investors will be watching developments as closely as hawks. (The views in this article are solely those of the author, a Reuters columnist.) Like this column? Check out Reuters' "Unhedged" (ROI), your essential new source for global finance commentary. Follow ROI on LinkedIn and X. You can also listen to the daily "Morning Bid" podcast on Apple, Spotify, or the Reuters app—subscribe for in-depth market and finance news, seven days a week. US 5-year auction has biggest 'tail' since 2022 https://fingfx.thomsonreuters.com/gfx/mkt/dwpkmkzogpm/TAIL.png (For the convenience of non-English speakers, Reuters provides automated translations of its reports

路透社•2026/10/06 13:11

Money market fund inflows plummet to 158 billion—Is short-term US Treasury liquidity flashing a warning sign?

Money market fund inflows have sharply dropped to $158 billion in the first three quarters of this year, driving Treasury yields higher. Increased volatility at the short end has raised market concerns about tightening short-term financing.

智通财经•2026/10/06 13:07