Bitget App
Trade smarter
Buy cryptoMarketsTradeFuturesStocksEarnInstitutionAI & More
Re (RE) Price Prediction: Technicals Flash Mixed Signals — What’s Next?

Re (RE) Price Prediction: Technicals Flash Mixed Signals — What’s Next?

CryptoNewsNetCryptoNewsNet2026/06/19 16:24
By:CryptoNewsNet
Back to the list

Re (RE) Price Prediction: Technicals Flash Mixed Signals — What’s Next?

Re (RE) Price Prediction: Technicals Flash Mixed Signals — What’s Next? image 0  coinedition.com 26 m
Re (RE) Price Prediction: Technicals Flash Mixed Signals — What’s Next? image 1

Re (RE) extended its sharp decline on Thursday, falling more than 31% over the past 24 hours as traders assessed whether the token can stabilize near a critical support zone. Despite the steep pullback, derivatives activity continues to expand rapidly, suggesting that market participants remain actively engaged with the asset’s next move.

The token traded around $0.4354 at the time of writing, while daily trading volume climbed above $147 million. Although RE recently rallied toward the $0.48 region, sellers regained control and pushed prices lower. Consequently, the token slipped below its short-term moving average, signaling weaker near-term momentum.

Technical Structure Shows Mixed Signals

Price action currently centers around the $0.4260 to $0.4300 support zone. Buyers have attempted to defend this area, preventing a deeper breakdown. However, the market remains vulnerable if selling pressure continues.
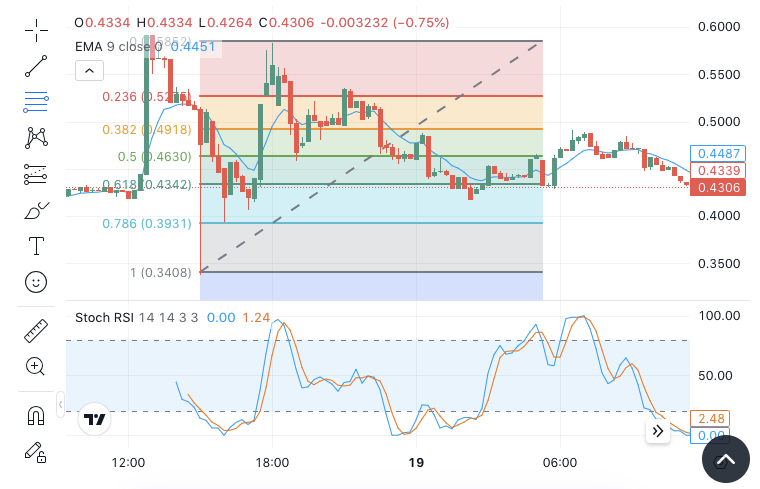
Re (RE) Price Prediction: Technicals Flash Mixed Signals — What’s Next? image 2 RE Price Dynamics (Source: Trading View)

The first resistance level sits between $0.4450 and $0.4487. This zone aligns with the nine-period exponential moving average and a recent rejection point. A successful move above this range could improve sentiment and encourage buyers to return.

Moreover, traders continue to monitor the $0.4630 level, which coincides with an important Fibonacci retracement area. Beyond that, the $0.4918 to $0.5200 range represents a major hurdle for any sustained recovery attempt.

Related: $XRP Price Prediction: 30M $XRP Left Whale Wallets as Active Addresses Crash 50%

On the downside, stronger support emerges between $0.4130 and $0.3910. This region may attract accumulation if the current floor fails. Additionally, the broader structure identifies $0.3408 as a significant swing support level.

Open Interest Surge Signals Growing Speculation

While price weakened, derivatives data painted a different picture. Open Interest expanded dramatically from roughly $1.2 million on June 18 to approximately $17.53 million on June 19.
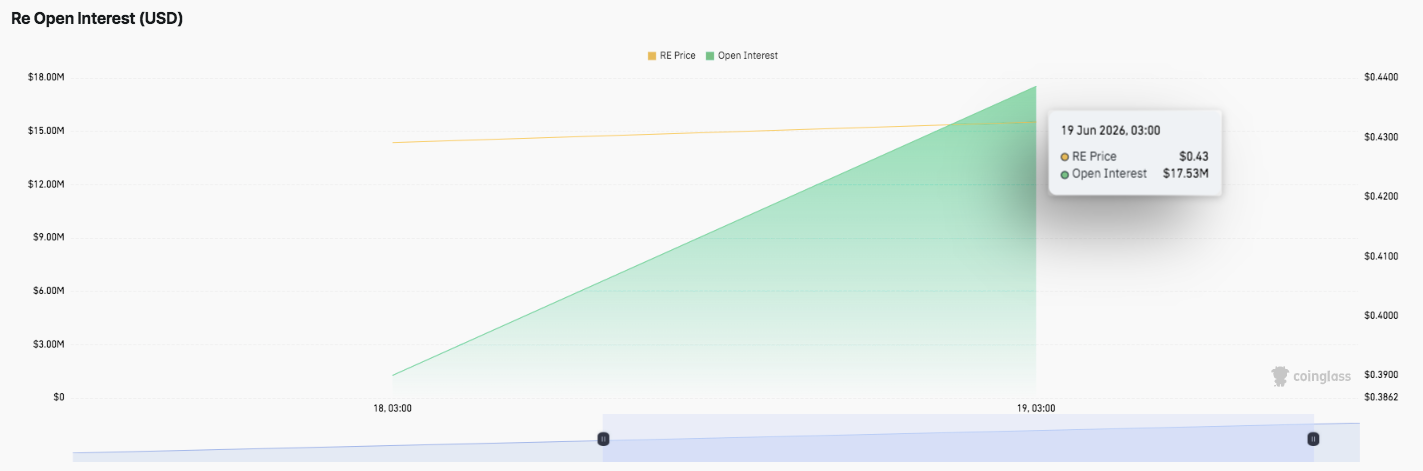
Re (RE) Price Prediction: Technicals Flash Mixed Signals — What’s Next? image 3 Source: Coinglass

Such growth often reflects fresh capital entering the market. Significantly, RE’s price also advanced during the period when Open Interest accelerated. This combination typically suggests that traders are opening new positions rather than simply closing existing ones.

However, elevated Open Interest can also amplify volatility. As a result, sudden liquidations or profit-taking activity could trigger sharp price swings in either direction.

Exchange Flows Highlight Investor Positioning

Meanwhile, spot market data revealed a negative netflow of approximately $104,830. The movement indicates that more RE tokens left exchanges than entered them during the latest reporting period.
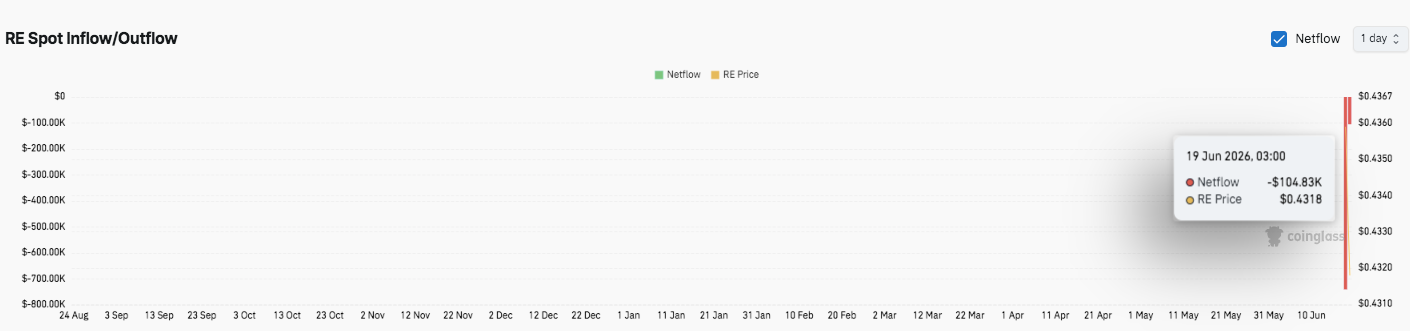
Re (RE) Price Prediction: Technicals Flash Mixed Signals — What’s Next? image 4 Source: Coinglass

Exchange outflows often suggest that investors prefer holding assets outside trading platforms. Hence, the trend may reduce immediate selling pressure if it continues. Nevertheless, the latest spike in activity also signals heightened market participation.

Related: Cardano Price Prediction: Calls Grow to Remove Hoskinson as ADA Tests a Familiar Bounce Zone

Technical Outlook for RE Price

RE continues to trade within a volatile corrective phase after a sharp intraday decline, yet the broader structure still reflects a range-bound market rather than a confirmed breakdown.

Upside levels: Immediate resistance sits at $0.4450–$0.4487, where the 9 EMA and recent rejection zone converge. A breakout above this band could open a recovery attempt toward $0.4630, a key Fibonacci midpoint. Further upside extends to $0.4918–$0.5200, which represents the major supply ceiling where previous rallies stalled.

Downside levels: Initial support remains at $0.4260–$0.4300, forming the current defense zone for buyers. A breakdown below this area exposes $0.4130–$0.3910, where stronger accumulation interest may emerge. If selling pressure accelerates further, $0.3408 becomes the major structural support for the broader trend.

Resistance ceiling: The $0.4630–$0.5200 region acts as the key medium-term barrier. RE must reclaim and sustain above the EMA cluster near $0.4450 to shift momentum back toward bullish control.

Will RE Rebound or Extend Correction?

RE appears to be compressing inside a broad consolidation range following a sharp volatility spike. Consequently, the next directional move likely depends on whether buyers defend the $0.4260 support base. Sustained defense could trigger a relief bounce toward $0.4630.

Related: Ethereum Price Prediction: Polymarket Turns Against $3,000 ETH as a Foundation Co-Director Exits

However, failure to hold current levels risks a deeper retracement toward lower Fibonacci zones. Additionally, rising open interest suggests increasing leverage exposure, which could amplify volatility in both directions. For now, RE remains in a pivotal zone where momentum confirmation will determine the next major move.

0
0

Disclaimer: The content of this article solely reflects the author's opinion and does not represent the platform in any capacity. This article is not intended to serve as a reference for making investment decisions.

Understand the market, then trade.
Bitget offers one-stop trading for cryptocurrencies, stocks, and gold.
Trade now!

You may also like

ROI - For the Trump-led Treasury, the "tail" of the auction is the most difficult part: McKeever

The views expressed in this article are solely those of the author, Reuters columnist Jamie McGeever. Reuters, Orlando, Florida, October 6 – U.S. Treasury auctions are typically dull, predictable, and not newsworthy. But these are not ordinary times, and the Trump administration now faces the risk of sluggish U.S. debt sales making headlines. The U.S. Treasury plans to issue nearly $120 billion in Treasuries this week, the first non-bill bond sales in two weeks: $58 billion in three-year notes on Tuesday, $39 billion in ten-year notes on Wednesday, and $22 billion in thirty-year bonds on Thursday. These auctions would usually be insignificant events, but due to the exceptionally weak performance of auctions from September 22 to 24—especially the five-year note auction on September 23, which triggered the largest spike in bond yields since April last year—they are attracting growing attention. Since then, yields have not only failed to retreat but have surged across most tenors to multi-decade highs. It's worth noting that the possibility of a U.S. Treasury auction "failing" is almost zero. Primary dealers—currently 26 Wall Street banks and institutions authorized by the New York Fed as market makers for Treasuries—are always involved. They effectively underwrite the sales, ensuring the smooth operation of the $30 trillion U.S. Treasury market, the most liquid market in the world. This, in turn, allows the entire global financial system to function, given that trillions of dollars in global debt, assets, and market derivatives are benchmarked against U.S. Treasuries. Treasuries are also the primary collateral for lubricating the financial “pipes” of the U.S. and global markets, including repo agreements, interbank loans, and financing. In short, as long as U.S. Treasuries remain the pillar of the global financial system, there will always be buyers at Treasury auctions. The question, as always, is at what price these bonds will be sold. Currently, borrowing costs in the secondary market are at their highest levels since the mid-2000s, so it's reasonable to expect that the Treasury will pay relatively high rates in the primary market as well. But as recent auctions have shown, negative surprises remain possible. "Too big to be absorbed by the market"? The $70 billion five-year auction on September 23 was among the most worrisome in years. Demand, as measured by the bid-to-cover ratio, was at a nine-year low. The Treasury ended up selling the notes at a yield of 5.033%, more than 3 basis points above the market yield at the close of bidding. Three basis points might not sound like much, but it's exceptional for a five-year note auction. This is the largest so-called "tail" since June 2022. According to JPMorgan analysts, the last time a five-year auction had a three-basis-point tail was back in 2011—amid the brewing debt ceiling crisis that eventually led to a U.S. credit rating downgrade in August that year. Currently, concerns over the U.S.'s daunting fiscal outlook are driving up long-term borrowing costs. As a result, markets generally expect the Trump administration to gradually shift the Treasury’s massive funding needs toward the lower-yield (and therefore lower-cost) short- and medium-term segments of the curve. That's why the five-year note auction two weeks ago sparked such concern. A three-basis-point tail is common in long bond auctions, but not in the "belly" of the yield curve. If the Treasury is forced to pay a higher premium to issue these bonds, then Houston, we have a problem. A large auction tail can be caused by many factors, including market volatility on the day of the auction or more concerning, fundamental issues that may erode demand over time. The two are often hard to distinguish because they are not mutually exclusive. On a brighter note, this unease has not yet spread to the short end of the yield curve. At least, not yet. Three-year and ten-year Treasury yields are up about 50 basis points from the last auction a month ago, hovering around 4.96% and 5.32%, respectively. The thirty-year yield is up roughly 35 basis points to 5.65%. These levels should be high enough to attract strong demand and ensure smooth sales, right? Maybe. But if surprises do occur, volatility and uncertainty could spill over across the market. Investors will be watching developments as closely as hawks. (The views in this article are solely those of the author, a Reuters columnist.) Like this column? Check out Reuters' "Unhedged" (ROI), your essential new source for global finance commentary. Follow ROI on LinkedIn and X. You can also listen to the daily "Morning Bid" podcast on Apple, Spotify, or the Reuters app—subscribe for in-depth market and finance news, seven days a week. US 5-year auction has biggest 'tail' since 2022 https://fingfx.thomsonreuters.com/gfx/mkt/dwpkmkzogpm/TAIL.png (For the convenience of non-English speakers, Reuters provides automated translations of its reports

路透社•2026/10/06 13:11

Money market fund inflows plummet to 158 billion—Is short-term US Treasury liquidity flashing a warning sign?

Money market fund inflows have sharply dropped to $158 billion in the first three quarters of this year, driving Treasury yields higher. Increased volatility at the short end has raised market concerns about tightening short-term financing.

智通财经•2026/10/06 13:07