
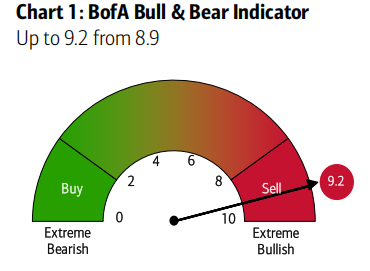
Extreme bullishness = Sell signal: Bank of America Bull & Bear Indicator rises to 9.2

Let’s put the conclusion up front: Bank of America’s core judgment now is that the bull market is still continuing, but has entered a stage where we have to "watch the referees."Let’s see how the game is decided at this point.
Its Bull & Bear Indicator has risen to 9.2, triggering a "sell" signal—this is the closest thing to a “rating” in the report, and I’ll explain separately what this means in detail.
On May 31, 2026, this indicator was at 8.5, and I wrote an article at the time to provide advance strategies:BofA: Post-Bubble Era Manual: Long the Humiliated, Short the Arrogant
Now, with the indicator rising to 9.2 this week, I believe it’s worth sharing another article with everyone.
Today’s summary centers on Bank of America’s latest weekly fund flow report, "The Flow Show," published on June 18, 2026, authored by BofA’s chief investment strategist Michael Harnett.
This issue’s subtitle is quite interesting—"V for Victory, Votes & Vigilantes".
Harnett uses three V’s to break down the underlying driving forces and risks behind this bull market into three distinct layers of logic.
The First V: Victory, but the Bubble Has Hit the Ceiling
The "victory" Harnett talks about refers to the period after the US-Iran conflict subsided, when the US returned to a track of "prosperity plus bubble," aiming to win in this AI competition with China.
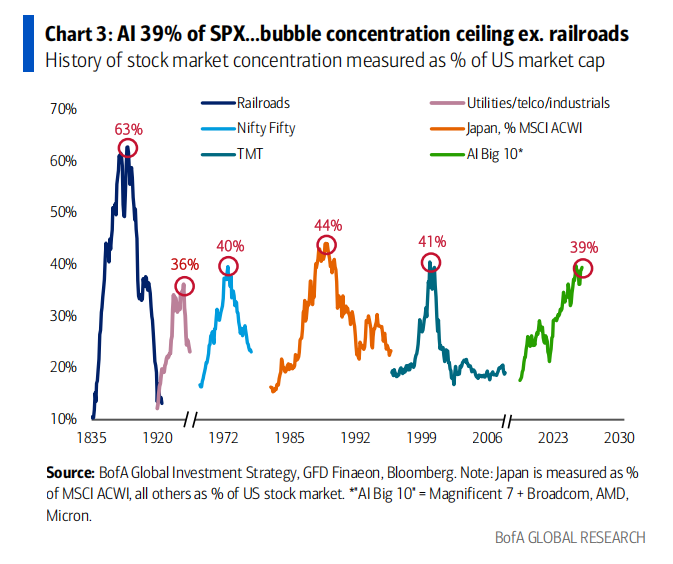
Here’s a number every US equity investor should remember: AI-related companies now account for39% of S&P 500 market cap. BofA put this in historical context—apart from the railroad bubble of the 1880s, this is the highest market concentration in US stock market history. In other words, in terms of market cap concentration, today’s AI rally is almost unmatched in history.
BofA emphasizes one key point:The essence of a bubble is "concentration," not "rotation." It draws a parallel with the IT bubble of 2000—from the lows of October 1998 to the peak in March 2000, only the tech sector outperformed the S&P 500; in the last six months before the bubble burst, only tech and telecom showed positive returns, with all other sectors falling.
The second layer is the political dimension of this rally.
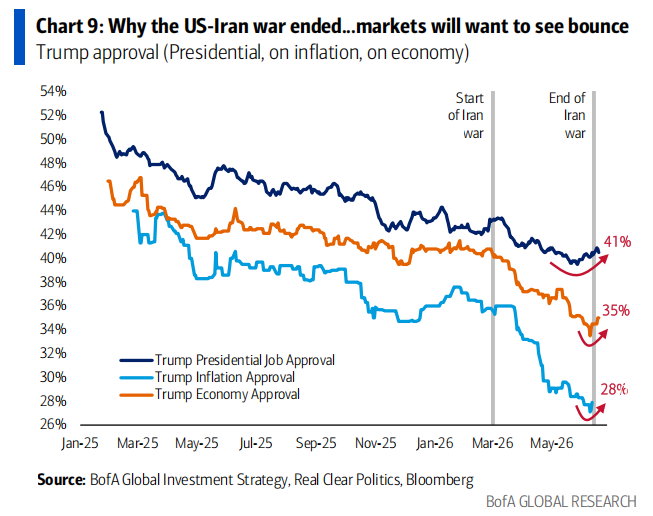
BofA observes that the end of the US-Iran conflict halted Trump’s declines in presidential approval, the economy, and inflation.
At the same time, Wall Street’s "satisfaction" with current policy has hit record highs—a telling number is that American households’ stock market wealth has increased by about $6 trillion so far this year. This is a classic "wealth–price spiral": rising stock prices fuel a wealth effect, and the wealth effect triggers more buying.
But BofA also highlights the greatest risk along this line: if the GOP loses the Senate in November, it could trigger a “triple whammy” of a falling dollar, lower yields, and a stock market drop. Their historical pattern: booms and bubbles are usually ended by two things—voters and bond vigilantes, plus occasional volatility events (like the yen or won crises).
The report also gives a time window: if Trump’s approval rating hasn’t rebounded significantly by September, bulls will start to lose confidence.
I highlight this section separately because it reminds us: a significant part of this bull market’s foundation is political and emotional, not purely fundamental. Political variables cannot be modeled from financial statements, which is why they are often underestimated by markets.
The third V, "Vigilantes," refers to the bond market—commonly called "bond vigilantes."
BofA anchors this at the start of the year: ever since Kevin Warsh was nominated to the Fed on January 30 (which was also when gold peaked and bitcoin dropped about 30% from its highs), the US Treasury yield curve flattened aggressively—the 2s10s spread compressed from 75 basis points to just 25. The underlying concern is inflation = rate hikes.
The report also mentions a less common but crucial signal: when the unemployment rate is below CPI, it’s almost always accompanied by a yield curve inversion.
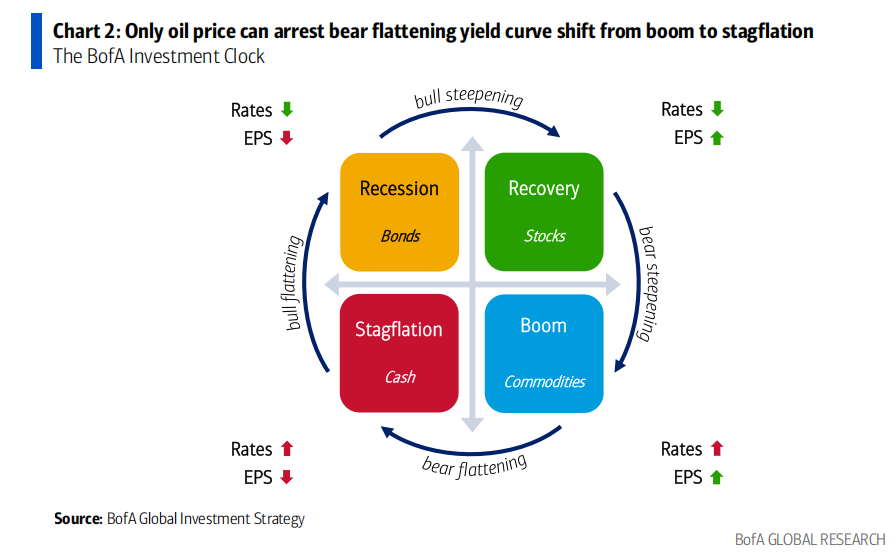
This leads to BofA’s “investment clock” view: the economy is sliding from “prosperity” (commodities) towards “stagflation” (cash). And the only thing that could arrest the slide is a crash in oil prices.
Only if oil prices fall can they offset the price spiral brought by AI and the wealth effect, bring CPI back below 3%, and potentially break the "prosperity-to-stagflation-recession" trend.
To put it differently: BofA actually puts oil in a very nuanced position—high oil prices drive inflation and stagflation, but a sharp fall in oil could actually save the market. It’s a somewhat counterintuitive chain.
Money is Still Pouring In Furiously, but That’s Precisely a Sell Signal
After discussing the three V’s, let’s look at the fund flows, and the picture becomes richer.
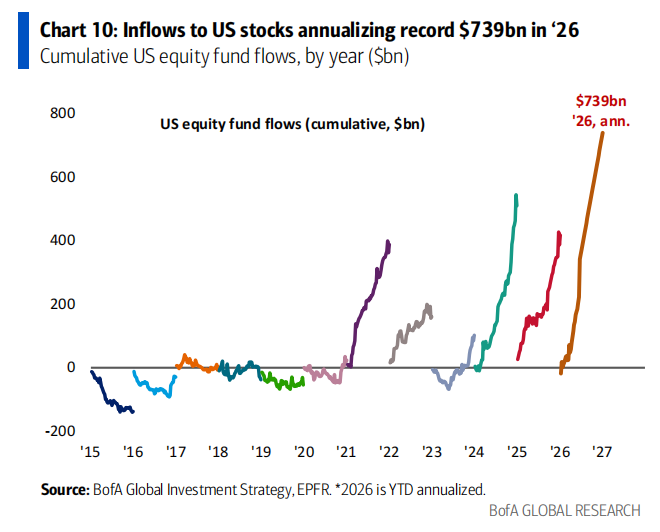
This week’s data is quite dramatic: $126.4 billion flowed into equities, with $119.2 billion net into US equities—the highest ever. At this pace, $739 billion would flow into US stocks this year—again, a record.
Tech sector saw a weekly inflow of $19.2 billion, also a record. Inflows to mid-caps and small-caps are among the largest on record. By contrast, European equities have seen net outflows for 10 consecutive weeks; Chinese equities for 12 consecutive weeks.
Money is rushing in, which sounds good. But BofA’s Bull & Bear Indicator, precisely at this moment, signals “sell”—up to 9.2, which is “extreme bullishness.”
Its logic is contrarian: when everyone is frenziedly buying and risk asset spreads are extremely narrow, it often means sentiment has peaked. Historically, since 2002, there have been 17 such sell signals; in the 2-3 months that followed, global equities dropped on average 2-3%, with a hit rate of about 60%, and maximum drawdowns of 15-20%.
I especially want to stress the word “contrarian.” Hot fund flows and market cap concentration at the ceiling are not contradictions—they are two sides of the same coin: because everyone crowds into a handful of winners, all adding in the same direction, the market grows fragile.
My Understanding:
On rhythm and alertness. The 9.2 “sell” signal from the Bull & Bear Indicator isn’t 100% accurate historically, but the potential drawdown it suggests (15-20%) is worth taking seriously.
My stance: when emotion and capital are both highly excited and concentration is at its peak, rather than guessing the top, it’s better to clarify your own positions, leverage, and risk tolerance in advance.
Bull markets don’t end with gradual deterioration of fundamentals, but with the sudden arrival of external shocks—this report actually highlights several possible flashpoints in advance.
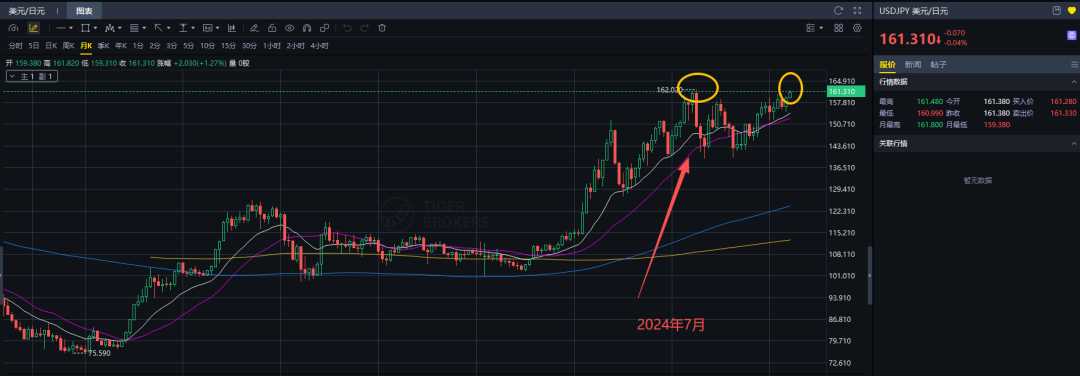
After this week’s close, another metric caught my attention: USD/JPY hit 162 in July 2024, and touched 161.82 intraday this Thursday.
Disclaimer: The content of this article solely reflects the author's opinion and does not represent the platform in any capacity. This article is not intended to serve as a reference for making investment decisions.
You may also like
ROI - For the Trump-led Treasury, the "tail" of the auction is the most difficult part: McKeever
The views expressed in this article are solely those of the author, Reuters columnist Jamie McGeever. Reuters, Orlando, Florida, October 6 – U.S. Treasury auctions are typically dull, predictable, and not newsworthy. But these are not ordinary times, and the Trump administration now faces the risk of sluggish U.S. debt sales making headlines. The U.S. Treasury plans to issue nearly $120 billion in Treasuries this week, the first non-bill bond sales in two weeks: $58 billion in three-year notes on Tuesday, $39 billion in ten-year notes on Wednesday, and $22 billion in thirty-year bonds on Thursday. These auctions would usually be insignificant events, but due to the exceptionally weak performance of auctions from September 22 to 24—especially the five-year note auction on September 23, which triggered the largest spike in bond yields since April last year—they are attracting growing attention. Since then, yields have not only failed to retreat but have surged across most tenors to multi-decade highs. It's worth noting that the possibility of a U.S. Treasury auction "failing" is almost zero. Primary dealers—currently 26 Wall Street banks and institutions authorized by the New York Fed as market makers for Treasuries—are always involved. They effectively underwrite the sales, ensuring the smooth operation of the $30 trillion U.S. Treasury market, the most liquid market in the world. This, in turn, allows the entire global financial system to function, given that trillions of dollars in global debt, assets, and market derivatives are benchmarked against U.S. Treasuries. Treasuries are also the primary collateral for lubricating the financial “pipes” of the U.S. and global markets, including repo agreements, interbank loans, and financing. In short, as long as U.S. Treasuries remain the pillar of the global financial system, there will always be buyers at Treasury auctions. The question, as always, is at what price these bonds will be sold. Currently, borrowing costs in the secondary market are at their highest levels since the mid-2000s, so it's reasonable to expect that the Treasury will pay relatively high rates in the primary market as well. But as recent auctions have shown, negative surprises remain possible. "Too big to be absorbed by the market"? The $70 billion five-year auction on September 23 was among the most worrisome in years. Demand, as measured by the bid-to-cover ratio, was at a nine-year low. The Treasury ended up selling the notes at a yield of 5.033%, more than 3 basis points above the market yield at the close of bidding. Three basis points might not sound like much, but it's exceptional for a five-year note auction. This is the largest so-called "tail" since June 2022. According to JPMorgan analysts, the last time a five-year auction had a three-basis-point tail was back in 2011—amid the brewing debt ceiling crisis that eventually led to a U.S. credit rating downgrade in August that year. Currently, concerns over the U.S.'s daunting fiscal outlook are driving up long-term borrowing costs. As a result, markets generally expect the Trump administration to gradually shift the Treasury’s massive funding needs toward the lower-yield (and therefore lower-cost) short- and medium-term segments of the curve. That's why the five-year note auction two weeks ago sparked such concern. A three-basis-point tail is common in long bond auctions, but not in the "belly" of the yield curve. If the Treasury is forced to pay a higher premium to issue these bonds, then Houston, we have a problem. A large auction tail can be caused by many factors, including market volatility on the day of the auction or more concerning, fundamental issues that may erode demand over time. The two are often hard to distinguish because they are not mutually exclusive. On a brighter note, this unease has not yet spread to the short end of the yield curve. At least, not yet. Three-year and ten-year Treasury yields are up about 50 basis points from the last auction a month ago, hovering around 4.96% and 5.32%, respectively. The thirty-year yield is up roughly 35 basis points to 5.65%. These levels should be high enough to attract strong demand and ensure smooth sales, right? Maybe. But if surprises do occur, volatility and uncertainty could spill over across the market. Investors will be watching developments as closely as hawks. (The views in this article are solely those of the author, a Reuters columnist.) Like this column? Check out Reuters' "Unhedged" (ROI), your essential new source for global finance commentary. Follow ROI on LinkedIn and X. You can also listen to the daily "Morning Bid" podcast on Apple, Spotify, or the Reuters app—subscribe for in-depth market and finance news, seven days a week. US 5-year auction has biggest 'tail' since 2022 https://fingfx.thomsonreuters.com/gfx/mkt/dwpkmkzogpm/TAIL.png (For the convenience of non-English speakers, Reuters provides automated translations of its reports
Money market fund inflows plummet to 158 billion—Is short-term US Treasury liquidity flashing a warning sign?
Money market fund inflows have sharply dropped to $158 billion in the first three quarters of this year, driving Treasury yields higher. Increased volatility at the short end has raised market concerns about tightening short-term financing.
TAO crypto price consolidates – Why $318 is Bittensor’s next big test
Tokenization Becomes a Key Focus for the U.K. Financial Sector

Crypto prices
More


