

The long-standing alliance between two giants of the crypto payments segment — XRP and Stellar (XLM) — has been disrupted, while their synchronized price dynamics, previously mentioned even by former Ripple CTO David Schwartz, are now a thing of the past.
Since the end of May 2026, the assets' charts have moved in opposite directions: while Stellar is recording major price gains, XRP continues to decline. Below is a detailed breakdown of tokenization fundamentals and the technical picture on the charts.
The battle for RWA
The sharp trend reversal was triggered by an official announcement from the Depository Trust & Clearing Corporation (DTCC) about plans to launch asset tokenization — including stocks, ETFs and U.S. Treasuries — on the Stellar blockchain in the first half of 2027. Fresh metrics by explain why Stellar has taken the lead in this sector, even though the XRP Ledger (XRPL) has more launched RWA projects: 302 versus 68 for Stellar.
The difference in asset behavior is explained by the volume and activity of real capital:
- Distributed Asset Value: On Stellar, this figure reached $2.83 billion, up 21.62% over 30 days. By comparison, XRPL stands at $360.32 million, down 10.83%.
- 30-day RWA transfer volume: On Stellar, this metric increased by 142.34% to $661.84 million, while XRPL recorded only $44.93 million.
- RWA investor base: The number of RWA holders on Stellar rose by 44.75% to 17,803 addresses, while XRPL has only 122 addresses.
The market certainly noticed these figures, which is why XLM has gained about 49.44% since the end of May, while XRP has shown negative dynamics over the same period, falling by 15.78%.
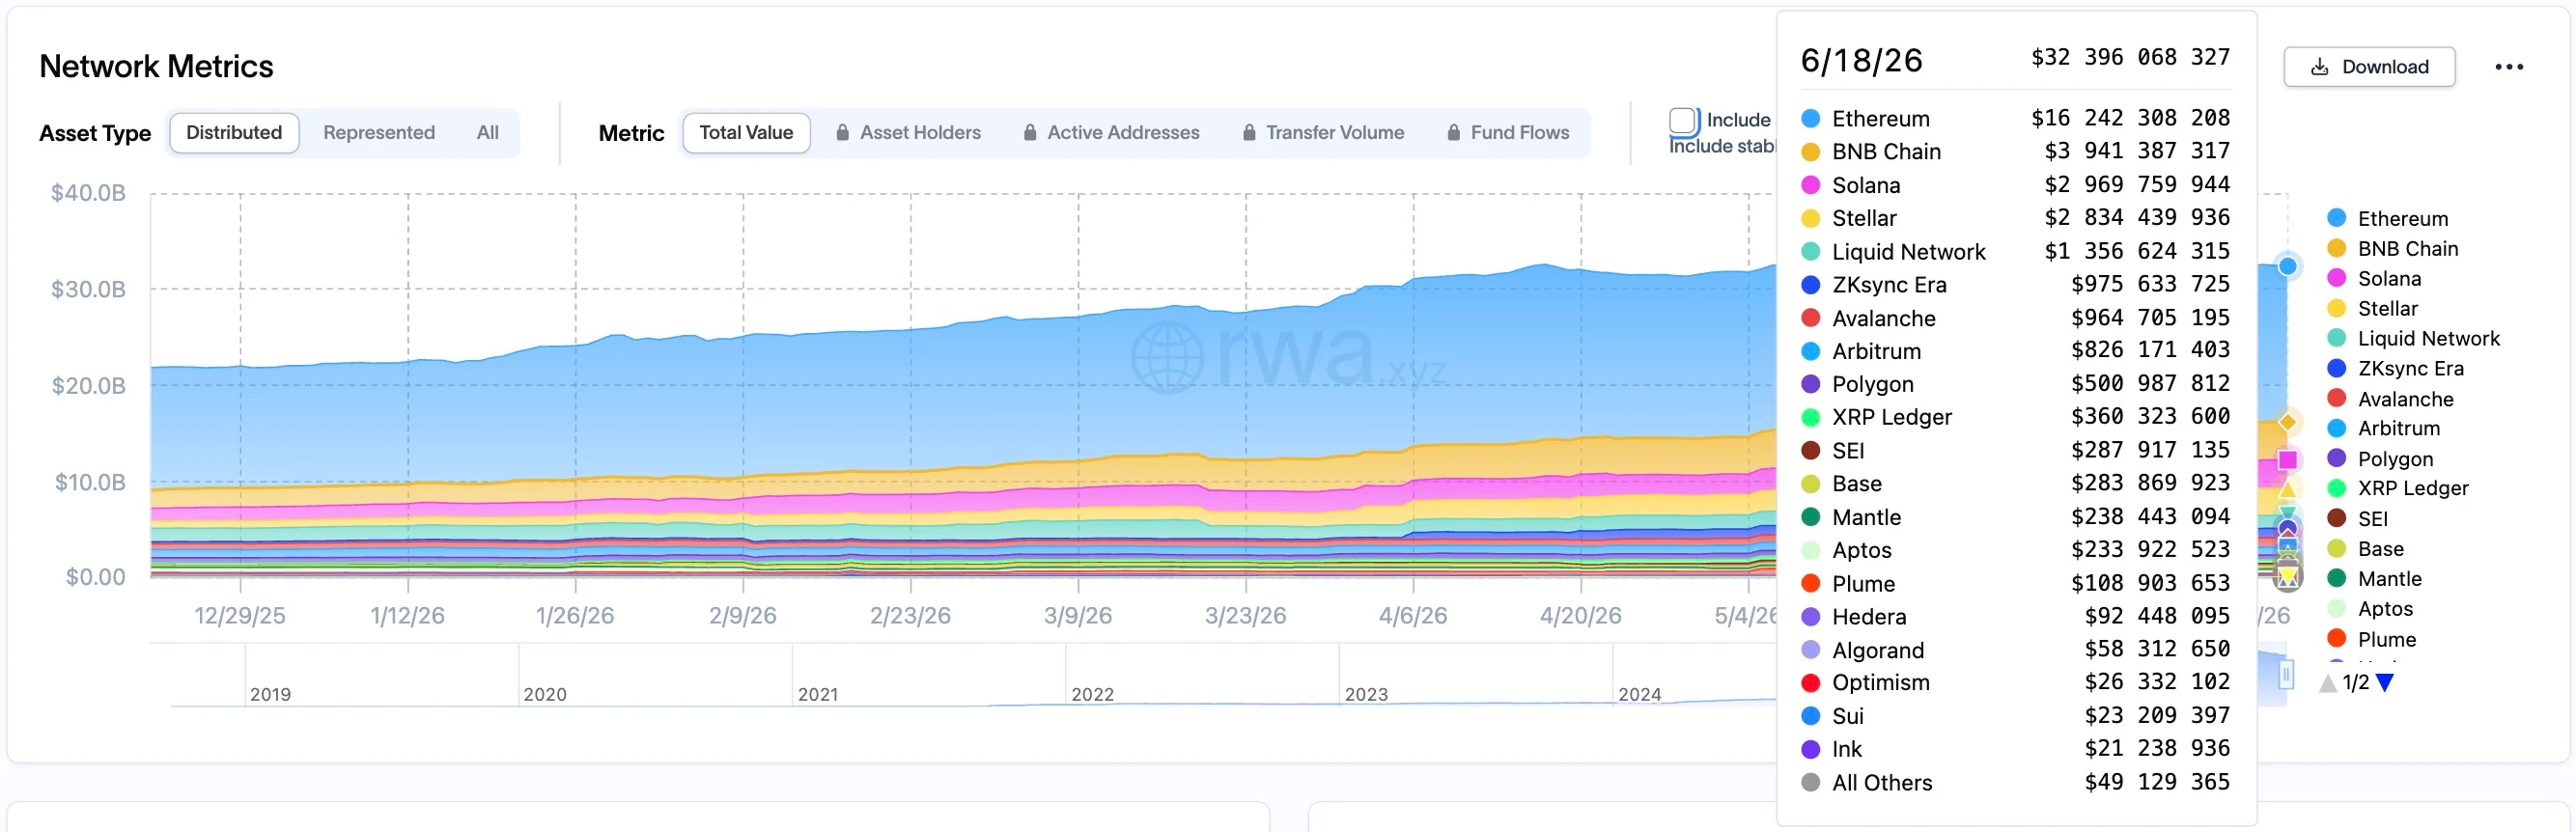 Total distributed asset value across key blockchains, Source:
RWA.xyz
Total distributed asset value across key blockchains, Source:
RWA.xyz
At the same time, XRPL maintains an advantage in total stablecoin volume, with $922.42 million versus Stellar's $296.24 million, as well as in total 30-day stablecoin transfer volume, with $5.11 billion versus Stellar's $4.27 billion.
What's happening on the charts?
The indicators on the daily timeframe reflect a deep technical gap between the two assets.
On the XLM chart, the price explosion at the end of May is clearly visible: the price expanded the Bollinger Bands, broke above the upper band and reached a peak near $0.29. The Relative Strength Index (RSI) fell to 57.64 after leaving overbought territory, which points to market stabilization.
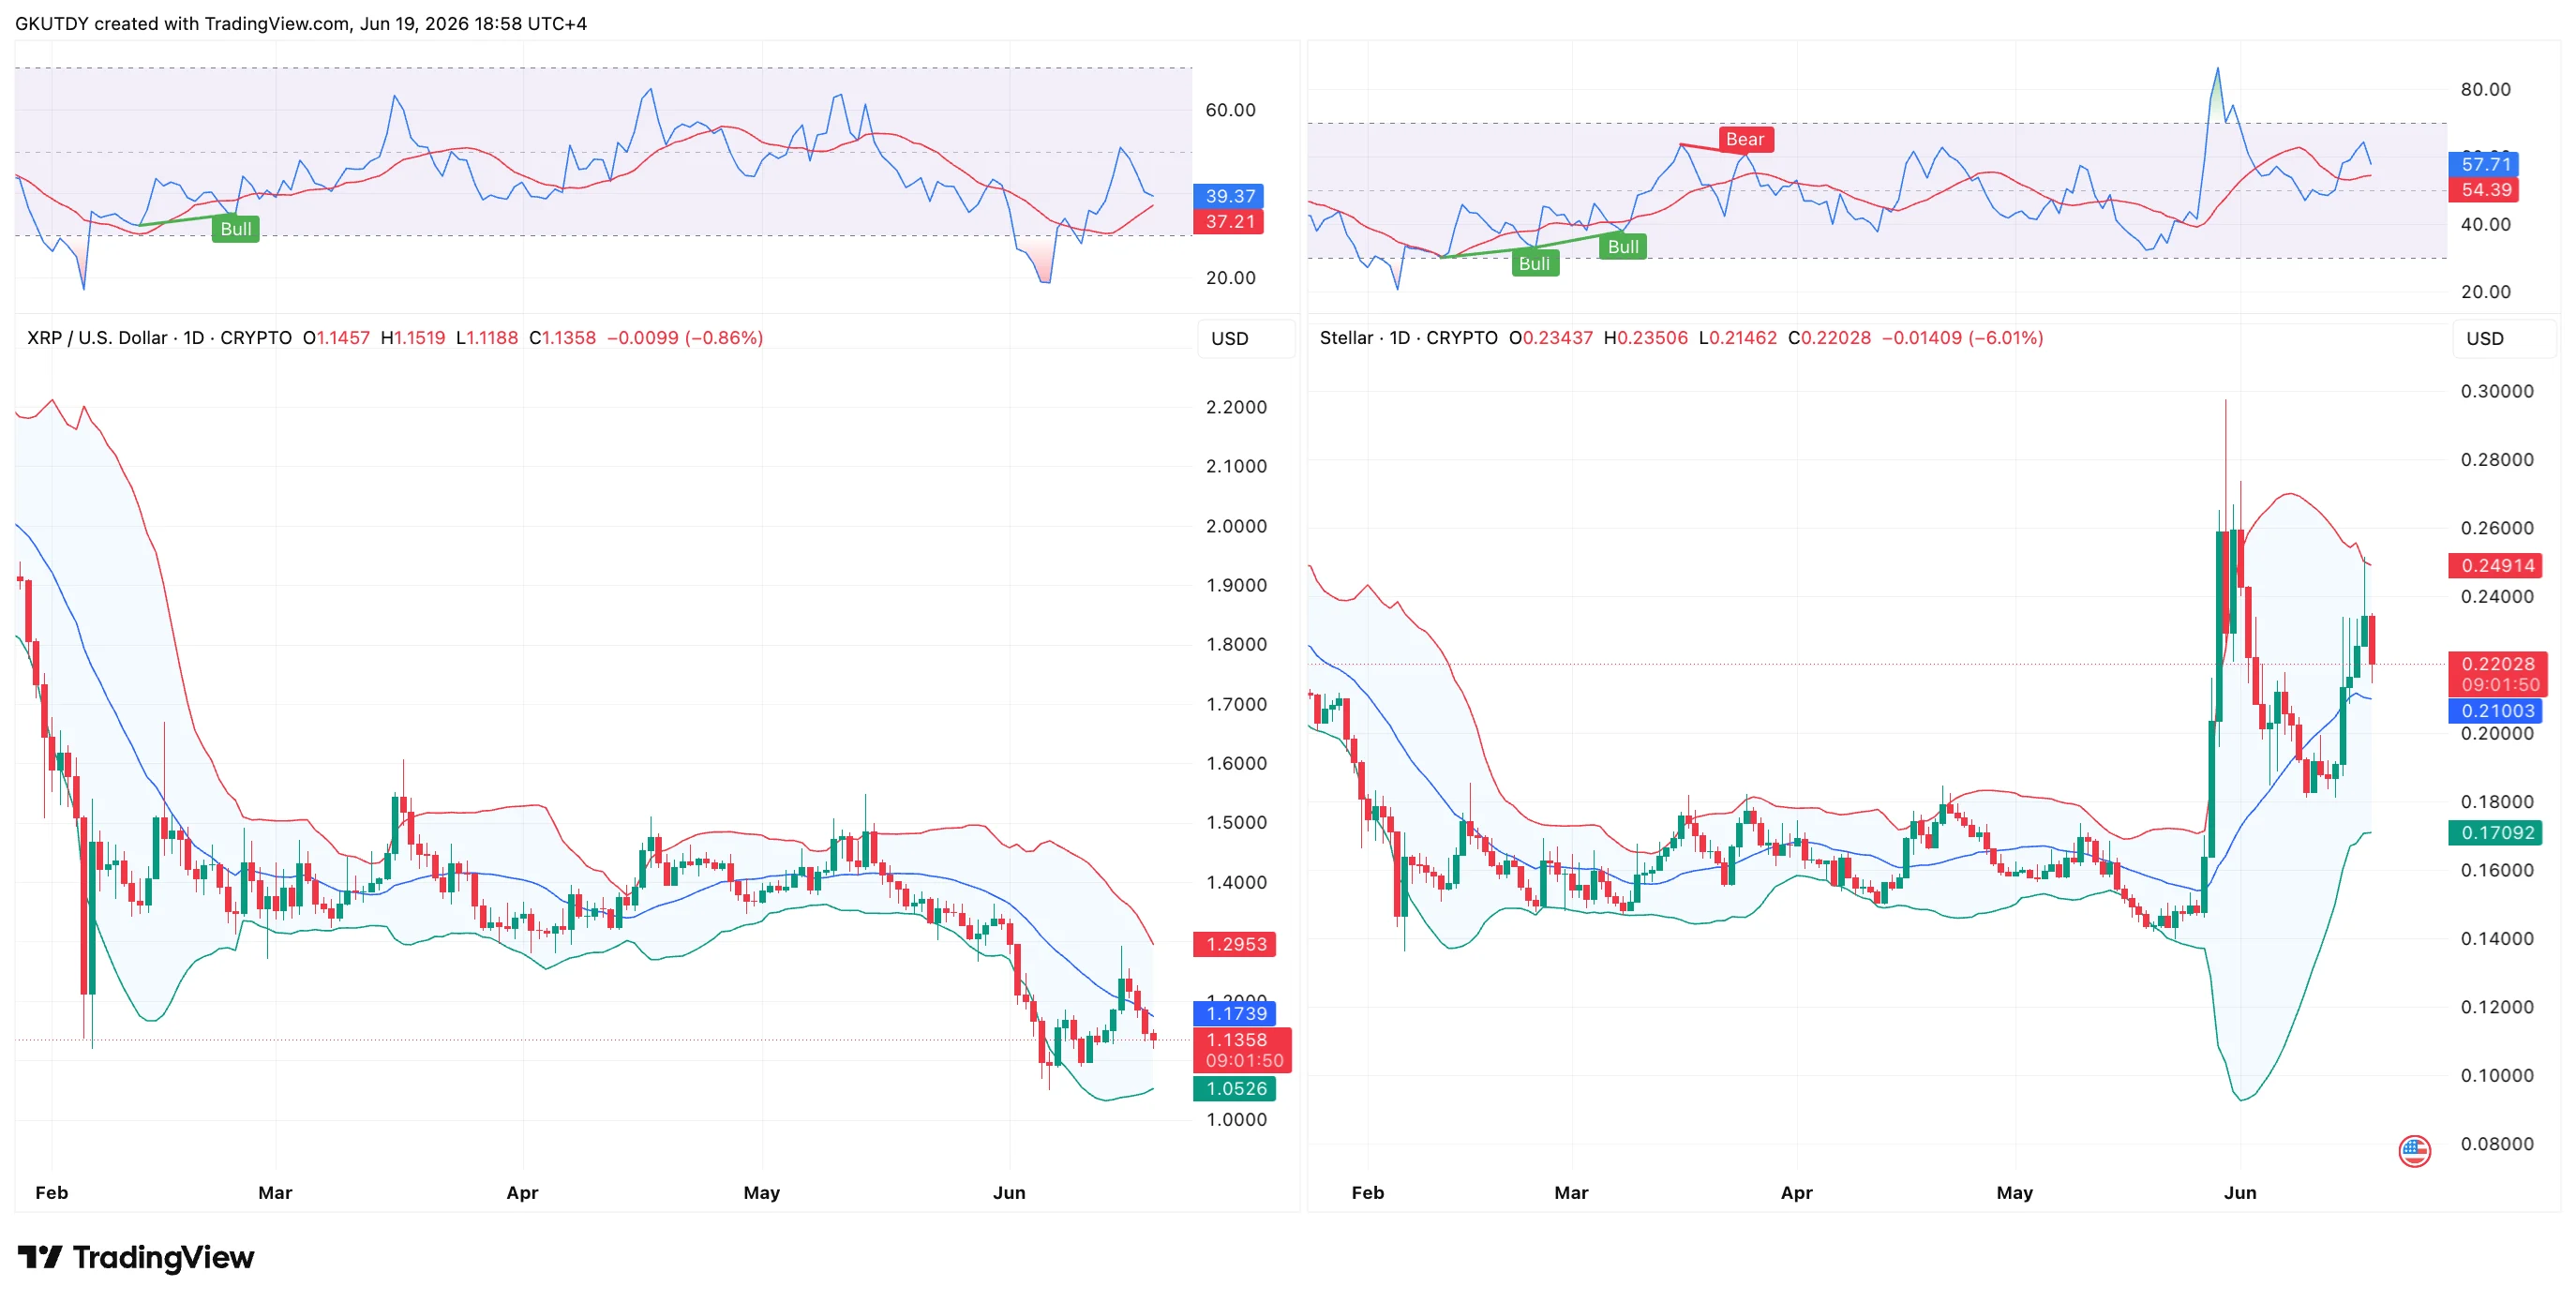 XRP and XL.M price chart with Bollinger Bands and RSI attached, Source:
TradingView
XRP and XL.M price chart with Bollinger Bands and RSI attached, Source:
TradingView
The XRP chart shows the opposite picture. In early June, the coin broke below the middle Bollinger Band, confirming the dominance of sellers. At the time of writing, XRP is trading near $1.13, trapped in a narrow range between the middle line at $1.1739 and the lower Bollinger Band at $1.0526.
Meanwhile, the RSI has fallen to 39.34, reflecting buyer weakness but also approaching oversold territory.
Can XRP repeat XLM's success?
The current narrowing of the Bollinger Bands on the XRP chart indicates that the asset is accumulating energy before a strong move out of the price range. There are two possible scenarios:
- Bullish scenario: If the price holds above the psychological level of $1.10 and the lower band at $1.0526, it would create a base for a rebound. To repeat Stellar's success, buyers need to restore XRPL's status as an active RWA platform, break through the middle line at $1.1739 and consolidate above the upper band at $1.2953. This would open the way toward targets in the $1.45–$1.60 area.
- Bearish scenario: If buyers fail to hold current positions and capital continues to flow into the Stellar ecosystem, XRP risks dropping from $1.13 to retest the lower Bollinger Band at $1.0526, with the possibility of further decline toward the strong psychological support level at $1.00.


