

 thecryptobasic.com
Chart structure suggests $XRP remains well above top DCA areas, and the price might drop further, offering better entry points.
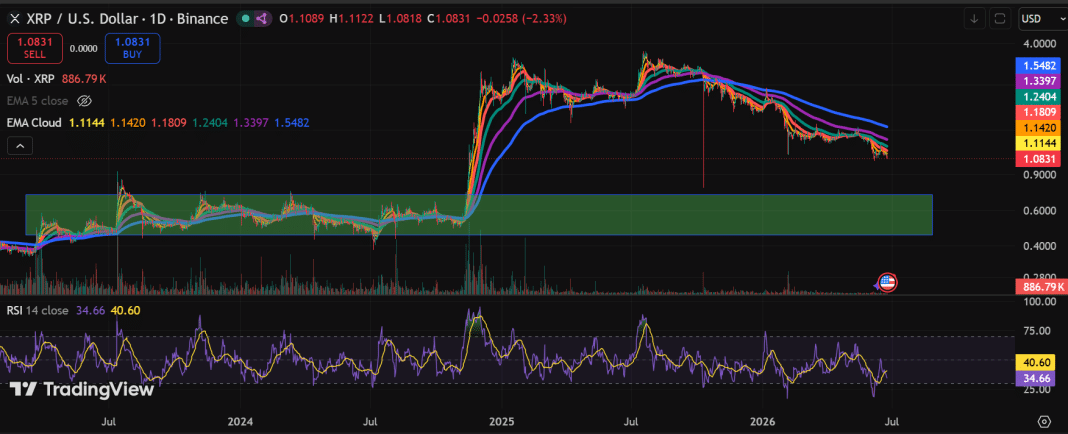
The $XRP price continues to trade under pressure, as the broader market maintains its corrective phase. Currently, $XRP’s price action sits beneath a cluster of declining moving averages that have capped every recovery attempt since the asset peaked at $3.66 in July 2025.
The broader trend remains firmly bearish, with momentum still favoring sellers as $XRP hovers near the $1.10 support. Meanwhile, chart analysis shows the price might see further downside.
$XRP Long-Term Support Zone Still Below Market Price
On the daily chart, the long-term area attracting the most attention is a broad accumulation range between roughly $0.42 and $0.72. This zone has repeatedly acted as a key price area during previous market cycles.
 $XRP DCA Zone
For context, $XRP consolidated around this area for most of 2023 and 2024 before breaking out. The token entered this price zone in March 2023 and accumulated for 20 months, breaking out in November 2024 to higher prices. So far, $XRP has spent 19 months above this support, during which it reached a new all-time high before the current correction.
This long-term range could act as an opportunity zone for $XRP should the current pullback persist. At this region, the asset’s risk-reward ratio becomes significantly more attractive, making it a good point to dollar-cost average (DCA) for existing holders or gain exposure for new holders. Currently at $1.08, the coin would have to fall by 33% to 61% to reach the $0.72 to $0.42 zone.
Price Trend Remains Weak Despite Extended Pullback
Further fueling the expectation that $XRP could fall further is the current structure setup. The asset is trading below multiple exponential moving averages. It trades below both short-term and long-term trend indicators like the 200 EMA, 100 EMA, 50 EMA, and 5 EMA on the daily timeframe, signaling price weakness.
These EMAs also continue to slope lower, reinforcing price weakness. Unless the trend changes, $XRP could continue to visit lower prices. The relative strength index (RSI) also shows a lack of upward momentum in the market as it begins to enter oversold territory.
Nonetheless, previous rallies came after sharp corrections that eventually revisited major support areas. If history repeats, $XRP could continue drifting lower to zones where long-term accumulation becomes more compelling before the next leg up.
On-chain data shows that traders are still expressing skepticism, preferring to observe $XRP from the sidelines. Trading volume has dropped 11% in the past 24 hours, with futures flows also experiencing a net outflow of $32.3 million. Open interest has also dropped by 1.15% to $2.54 billion in the past day.
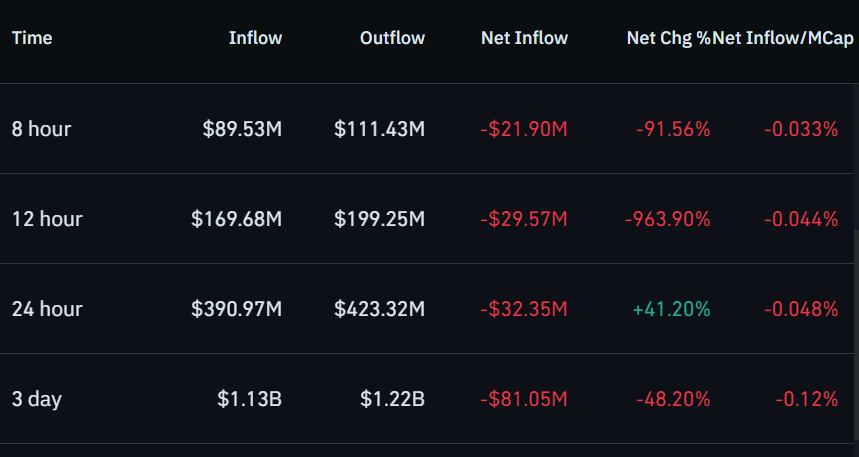 $XRP Futures Flow/Coinglass


