
A visual overview of commodity support and resistance: Gold, Silver, Oil, Gas + Platinum, Palladium, Copper, and Agricultural Futures (June 26, 2026)

Huitong Finance June 26 —— A chart showing commodity support and resistance: Gold, silver, oil and gas + platinum, palladium, copper + agricultural futures. Last updated on Friday, June 26, 2026, at 07:15. It specifically covers 14 varieties, including gold, silver, platinum, palladium, copper + crude oil, natural gas, fuel oil + wheat, corn, cotton. For more details, please refer to the Huitong Finance custom chart.
A chart showing commodity support and resistance: Gold, silver, oil and gas + platinum, palladium, copper + agricultural futures. Last updated on Friday, June 26, 2026, at 07:15. It specifically covers 14 varieties, including gold, silver, platinum, palladium, copper + crude oil, natural gas, fuel oil + wheat, corn, cotton. For more details, please refer to the content of the Huitong Finance custom chart.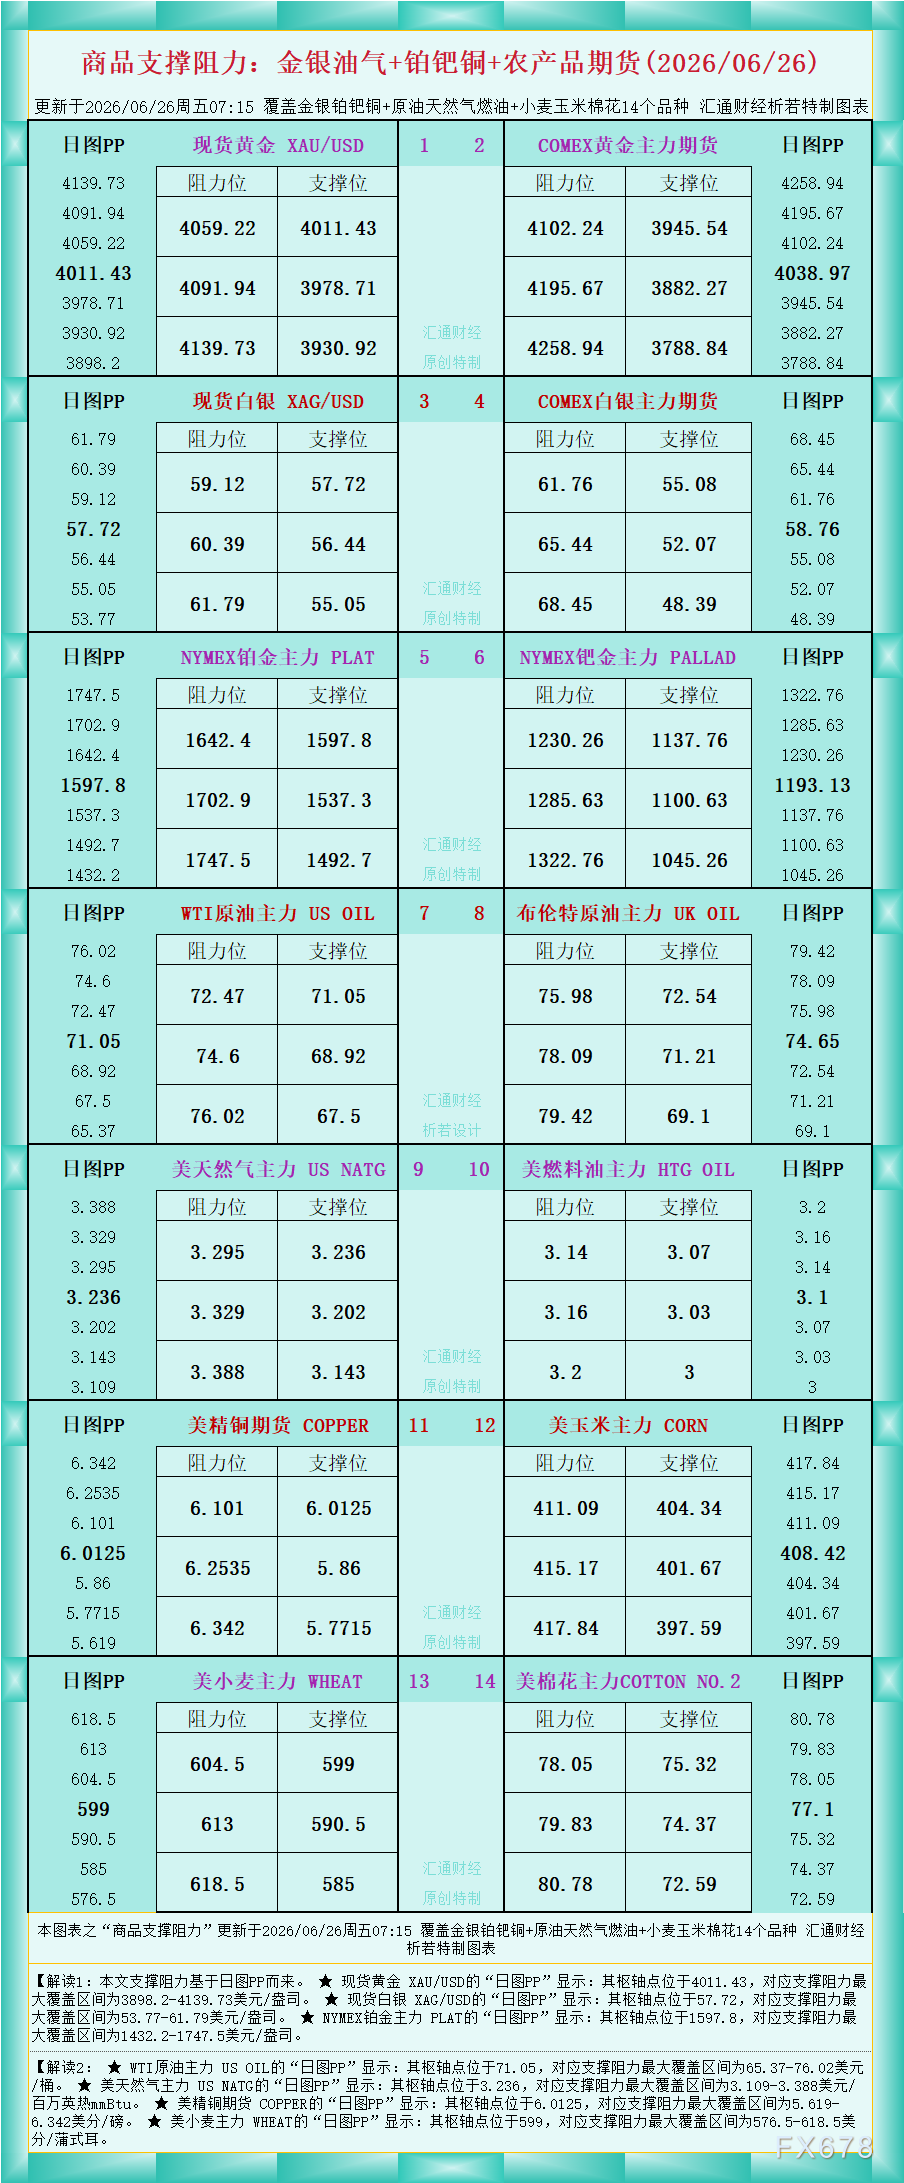
According to the chart data, Interpretation 1: The support and resistance in this article are based on the daily chart PP.
★ The daily chart PP for spot gold XAU/USD shows: its pivot point is at 4011.43, with the largest support and resistance range covered between $3898.2–$4139.73/oz.
★ The daily chart PP for spot silver XAG/USD shows: its pivot point is at 57.72, with the largest support and resistance range covered between $53.77–$61.79/oz.
★ The daily chart PP for NYMEX platinum main contract PLAT shows: its pivot point is at 1597.8, with the largest support and resistance range covered between $1432.2–$1747.5/oz.
Interpretation 2:
★ The daily chart PP for WTI crude oil main contract US OIL shows: its pivot point is at 71.05, with the largest support and resistance range covered between $65.37–$76.02/barrel.
★ The daily chart PP for US natural gas main contract US NATG shows: its pivot point is at 3.236, with the largest support and resistance range covered between $3.109–$3.388/million British thermal units mmBtu.
★ The daily chart PP for US copper futures COPPER shows: its pivot point is at 6.0125, with the largest support and resistance range covered between 5.619–6.342 cents/pound.
★ The daily chart PP for US wheat main contract WHEAT shows: its pivot point is at 599, with the largest support and resistance range covered between 576.5–618.5 cents/bushel.
For more interpretations on other varieties, please refer to the chart.
Disclaimer: The content of this article solely reflects the author's opinion and does not represent the platform in any capacity. This article is not intended to serve as a reference for making investment decisions.
You may also like
42% premium, five years to break even with capital cost, Schneider Electric sets record with $23 billion acquisition of PTC, stock price plunges
Schneider Electric’s acquisition of industrial software company PTC marks the latest move by European industrial companies to accelerate their bets on AI. While the strategic rationale is acknowledged by analysts, the financial cost of the deal is heavy. PTC is expected to generate only about $1.5 billion in operating profit by 2031, and the anticipated cost savings to be realized three years from now will only contribute an additional $280 million.
Custodia Bank CEO Caitlin Long warns tokenized deposits could outpace stablecoins

Spacex closed up 7.6%, reaching a new high since June, helping Musk "regain" his trillionaire status
SpaceX's stock surged nearly 8% on Monday, with Elon Musk's net worth rebounding to approximately $1.03 trillion, reclaiming the top spot on the billionaire list. Morgan Stanley released a bullish report, setting a target price of $300 and stating that the company's value is underestimated. The rally was driven by multiple catalysts, including expectations for Starship recovery, expansion of AI business, and over $12.7 billion in defense contracts.
LBMA 2026: Gold is sending a message as debt fears fuel the debasement trade
Crypto prices
More


