
Chainlink price remains under pressure in bearish channel, is $6 next?

Chainlink has extended its weekly decline after a sell-the-news reaction to Project Pangea, a multi-billion-dollar options expiry, and persistent weakness across the crypto market pushed LINK back toward a key long-term support zone.
- Chainlink has dropped to the $7 support zone as a sell-the-news reaction and options expiry intensified selling pressure.
- A bearish channel, weak momentum indicators, and the Supertrend signal keep the risk of a move toward $6 alive.
- Analysts identify the $6.30 support area as critical, while a recovery above $7.70 could ease downside pressure.
According to crypto.news price data, Chainlink (LINK) fell from a June 22 high near $8 to an intraday low of around $7 on June 26 before stabilizing near $7.16 at press time.
LINK’s drop accelerated as traders locked in profits following the June 23 launch of Project Pangea, a global foreign-exchange infrastructure initiative developed alongside European and South Korean banking consortia representing more than $10 trillion in assets under management.
Although the initiative strengthened Chainlink’s long-term enterprise case, short-term sentiment deteriorated ahead of Friday’s estimated $11 billion crypto options expiry. The large derivatives event pushed many digital assets toward their max-pain levels, triggering liquidations across leveraged altcoin positions and adding fresh selling pressure to LINK.
Macro conditions also remained unfavorable. Bitcoin’s drop below the $60,000 level weighed on the broader altcoin market as investors continued reducing exposure to risk assets. Consecutive weeks of U.S. spot Bitcoin ETF outflows, expectations that the Federal Reserve could keep interest rates elevated for longer, and delays surrounding U.S. crypto legislation further reduced appetite for speculative assets. At the same time, institutional capital continued rotating into artificial intelligence-related equities instead of digital assets.
Derivatives positioning has offered little relief. Leveraged long liquidations accelerated as LINK lost successive support levels, while declining open interest and cautious positioning suggested traders have reduced directional exposure rather than attempting aggressive dip buying.
Weekly structure keeps long-term downside risk in focus
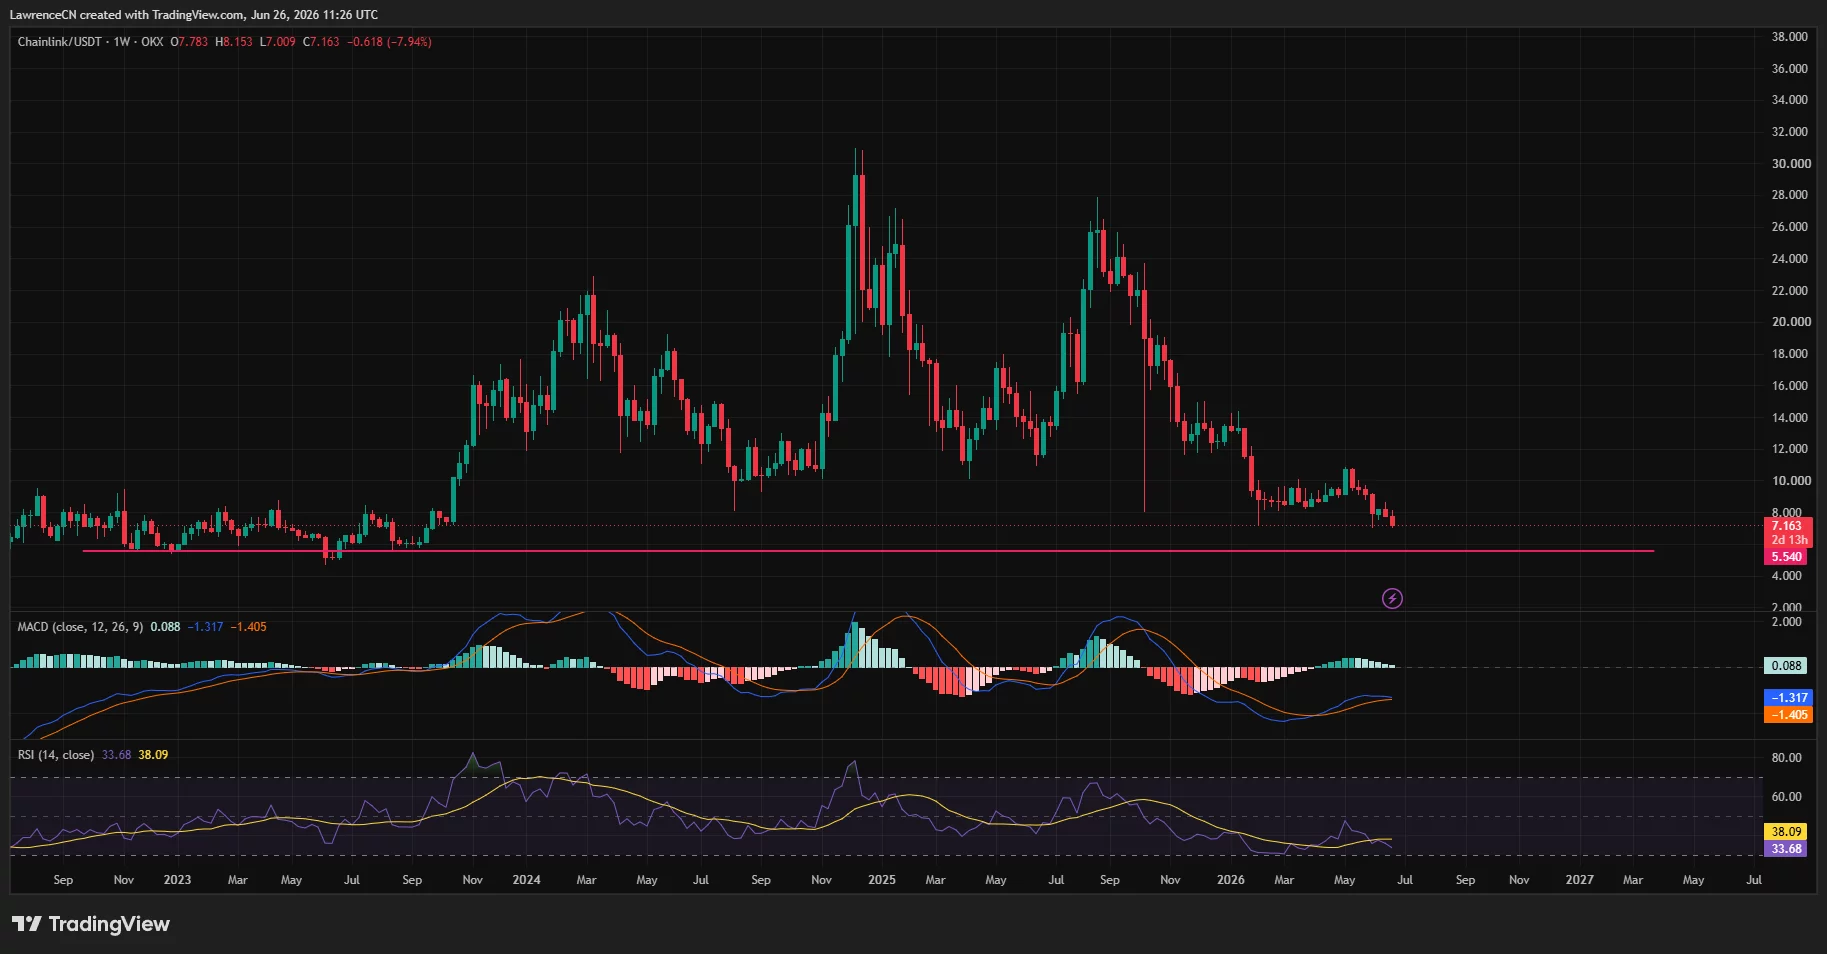
On the weekly chart, LINK remains in a prolonged downtrend after failing to reclaim resistance near $8. The latest decline has brought the token close to a multi-year support area around $5.50-$6.30, where buyers repeatedly entered the market during previous corrections.
 Chainlink weekly price chart — June 26 | Source:
crypto.news
Chainlink weekly price chart — June 26 | Source:
crypto.news
Momentum indicators continue to favor sellers. The weekly RSI has dropped to around 34 and remains below its signal line without entering deeply oversold territory, leaving room for another leg lower. Meanwhile, the MACD remains below the zero line despite a modest narrowing of bearish momentum, showing that bulls have yet to regain control.
A decisive weekly close beneath the long-term support zone could expose the psychological $6 level, while a sustained recovery above $8 would be needed to weaken the current bearish structure.
Bearish channel and Supertrend cap any recovery attempts
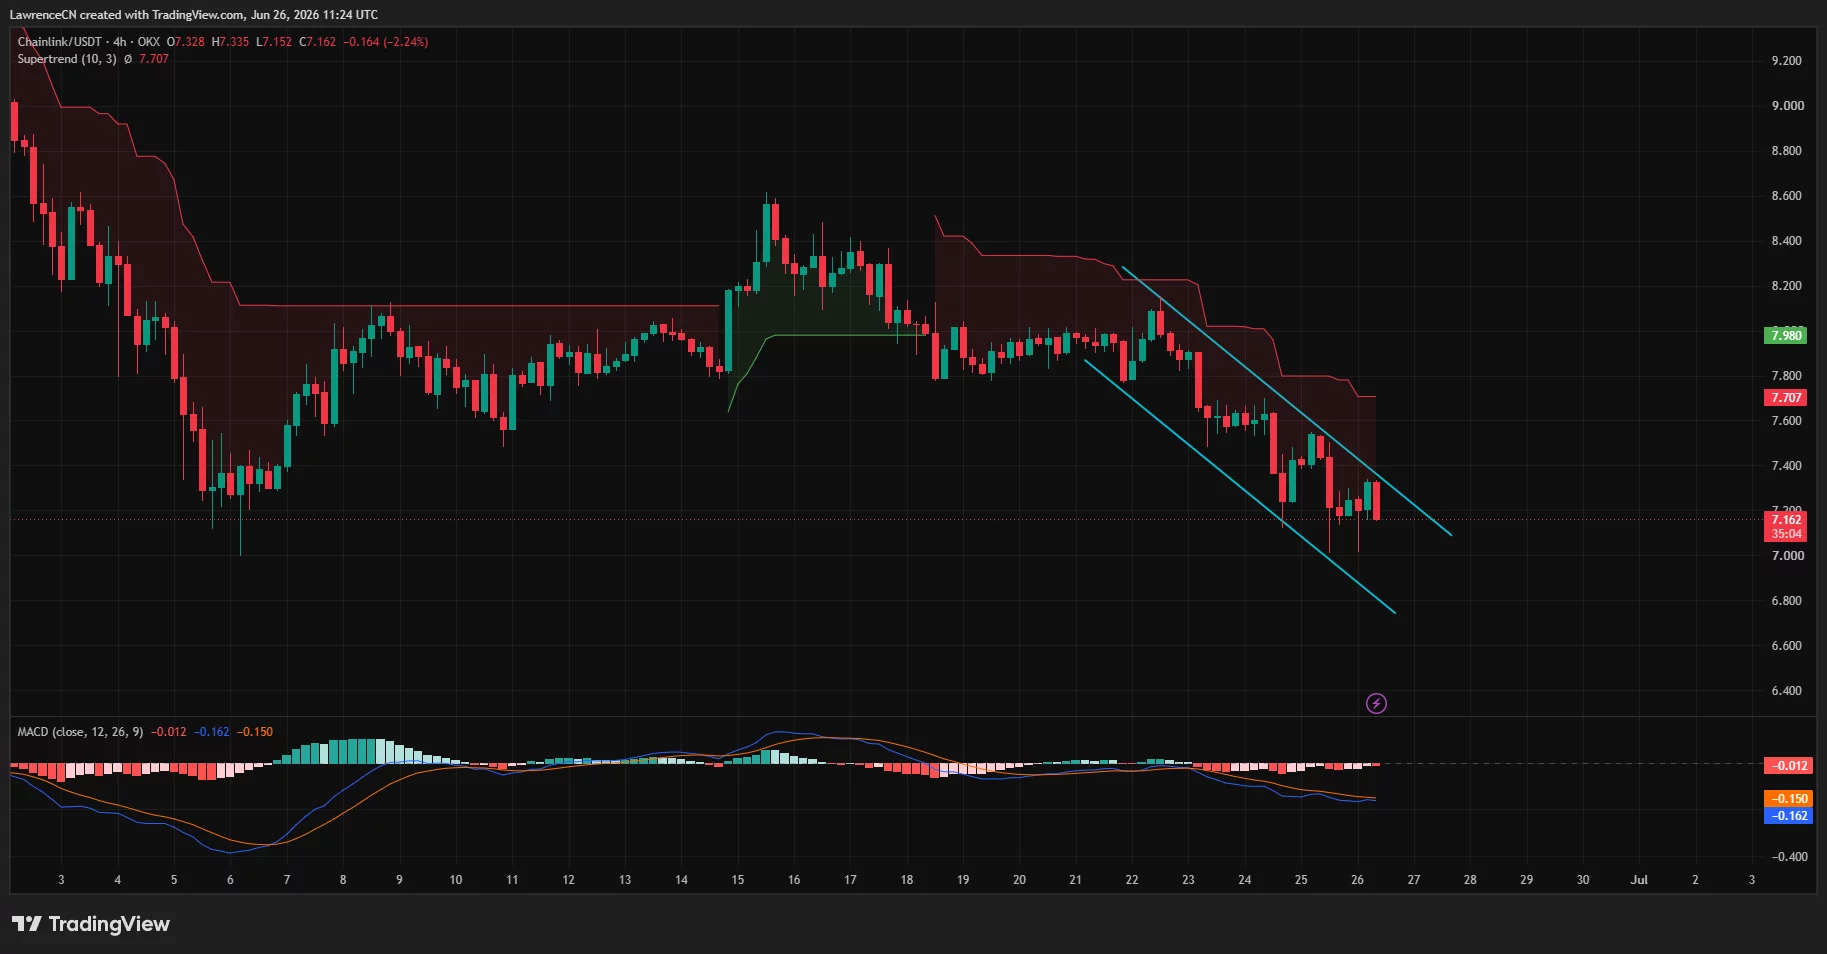
The four-hour chart shows LINK trading inside a well-defined descending channel that has guided the price lower since June 22. Every rebound has stalled near the upper trendline, while the Supertrend indicator continues to print a sell signal with dynamic resistance around $7.70.
 Chainlink 4-hour price chart — June 26 | Source:
crypto.news
Chainlink 4-hour price chart — June 26 | Source:
crypto.news
MACD on the four-hour timeframe remains below the zero line, although the histogram has flattened after the latest selloff, suggesting bearish momentum has slowed rather than reversed. Unless buyers reclaim the channel resistance and break above the Supertrend barrier, the path of least resistance remains lower.
Failure to defend the $7 region could send LINK toward the $6.30 support identified by Martinez, with the major psychological $6 level becoming the next downside target. On the upside, reclaiming $7.70 could allow the token to challenge the $8 resistance zone, where sellers regained control earlier this week.
Disclaimer: The content of this article solely reflects the author's opinion and does not represent the platform in any capacity. This article is not intended to serve as a reference for making investment decisions.
You may also like
Spacex closed up 7.6%, reaching a new high since June, helping Musk "regain" his trillionaire status
SpaceX's stock surged nearly 8% on Monday, with Elon Musk's net worth rebounding to approximately $1.03 trillion, reclaiming the top spot on the billionaire list. Morgan Stanley released a bullish report, setting a target price of $300 and stating that the company's value is underestimated. The rally was driven by multiple catalysts, including expectations for Starship recovery, expansion of AI business, and over $12.7 billion in defense contracts.
LBMA 2026: Gold is sending a message as debt fears fuel the debasement trade
This year, only tech billionaires are making money: the AI boom drives a $845 billion surge in net worth, with Elon Musk alone accounting for nearly 40%.
According to the Bloomberg Billionaires Index, out of the world's 500 richest people, approximately 100 technology industry billionaires saw their combined wealth increase by $845 billion in the first nine months of this year, setting a historical record for the period. Meanwhile, billionaires from non-technology sectors saw their collective wealth shrink by $62 billion during the same timeframe. Elon Musk alone added $310 billion to his wealth in the first nine months, accounting for about 40% of the total increase in the index.
Is Bitcoin Heading Toward $90,000? Bloomberg Legend Mike McGlone and Three Experts Weigh In

Crypto prices
More


