
Bitget App
Trade smarter
Buy cryptoMarketsTradeFuturesStocksEarnInstitutionAI & More
Jito hits $1.75B revenue milestone, but what does this mean for its price rally?

Jito hits $1.75B revenue milestone, but what does this mean for its price rally?

CryptoNewsNetCryptoNewsNet2026/06/27 19:03
By:CryptoNewsNet
Back to the list

Jito hits $1.75B revenue milestone, but what does this mean for its price rally?

Jito hits $1.75B revenue milestone, but what does this mean for its price rally? image 0  ambcrypto.com 34 m
Jito hits $1.75B revenue milestone, but what does this mean for its price rally? image 1

Market activity across the Jito network has accelerated significantly of late.

The protocol has generated $1.75 billion in gross revenue, making it one of the strongest-performing projects in the Solana ecosystem. Most of that revenue—about 81%—came from MEV rewards, while staking rewards accounted for the remainder.

These metrics suggest Jito’s infrastructure is handling more economic activity as users continue to rely on the protocol for staking and MEV services. That’s not all though as that growth is also beginning to show up elsewhere.
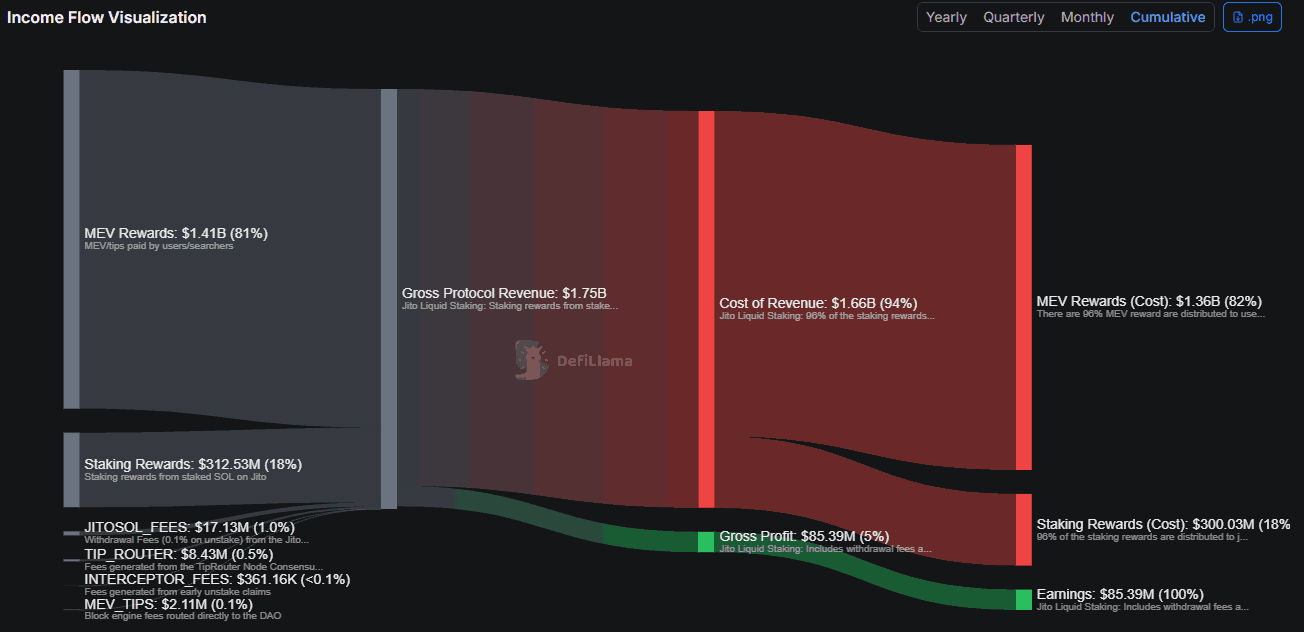
Jito hits $1.75B revenue milestone, but what does this mean for its price rally? image 2 Source: DefiLlama

Is the revenue growth translating into user activity?

In fact, network participation has strengthened over the past few days too.

The number of active addresses registered a major hike, pointing to significant engagement across the ecosystem. At the same time, trading volume expanded by nearly 90% to $102 million over the last 24 hours.

These metrics often move together.

More active addresses usually indicate broader user participation, while an uptick in trading volume often means capital may be flowing back into the market. Together, they seemed to paint a picture of increasing network activity rather than a short-lived spike in speculation.

That makes the recent revenue milestone more meaningful too. It is evidence that the protocol isn’t just attracting attention—it is also generating sustained economic activity.
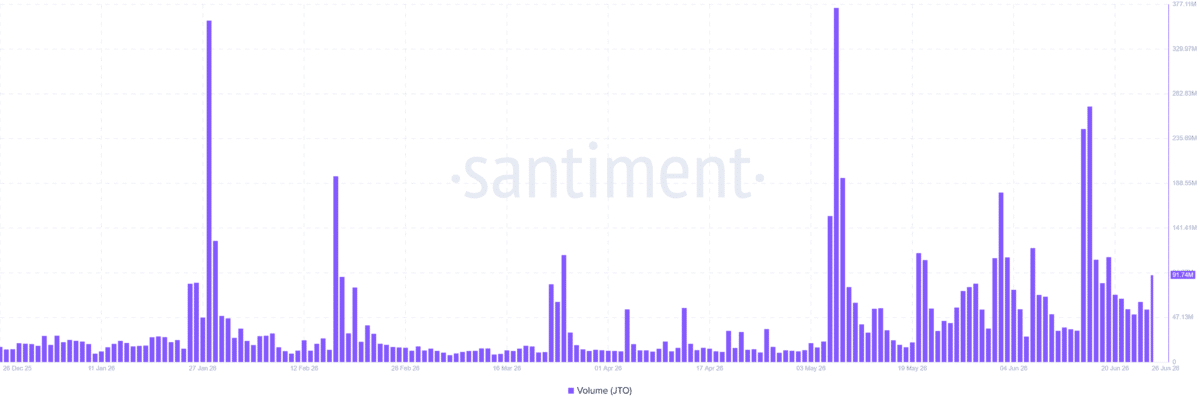
Jito hits $1.75B revenue milestone, but what does this mean for its price rally? image 3 Source: Santiment

Is the market beginning to recognize that growth?

Well, the improving fundamentals are now starting to appear on the chart too.

After spending months consolidating, $JTO broke above a bullish flag pattern on the daily timeframe. Since then, the price has continued to respect an ascending trendline that has produced multiple rebounds since early May.

If the momentum holds, the trendline resistance could be the next target for the token’s buyers.

In fact, the technical structure appeared to be catching up with what on-chain data has been showing for weeks. Whether the breakout develops into a larger rally will ultimately depend on whether network activity continues to expand.

At the time of writing, the latest metrics hinted at a bullish run continuation. Revenue has been growing, users are becoming more active, and trading participation registered a hike too.

In other words, the recent price breakout may simply be the market beginning to reflect those improving fundamentals.
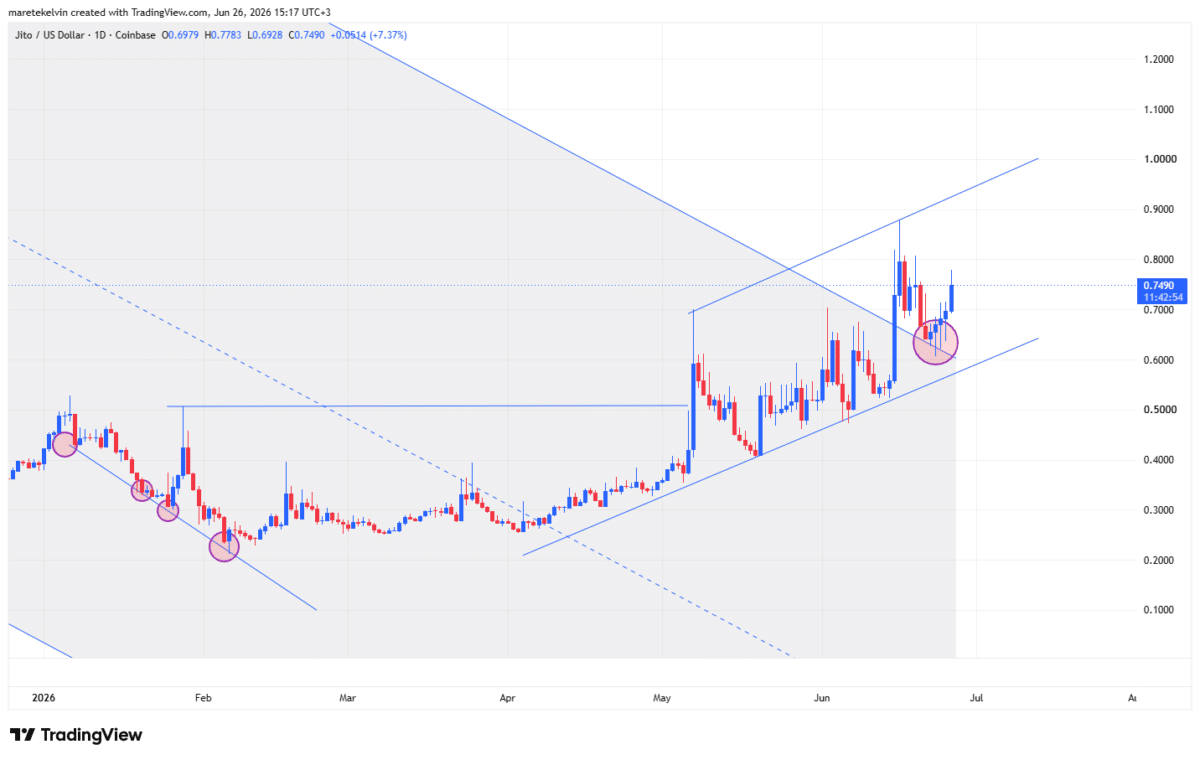
Jito hits $1.75B revenue milestone, but what does this mean for its price rally? image 4 Source: TradingView

Final Summary

  • Jito generated $1.75 billion in protocol revenue, highlighting sustained network usage.
  • Hike in active addresses and a $50 million uptick in trading volume coincided with $JTO’s breakout above a multi-month bullish flag.
0
0

Disclaimer: The content of this article solely reflects the author's opinion and does not represent the platform in any capacity. This article is not intended to serve as a reference for making investment decisions.

Understand the market, then trade.
Bitget offers one-stop trading for cryptocurrencies, stocks, and gold.
Trade now!

You may also like

VIX surges to highest level since the tariff dispute in April last year; Goldman Sachs Fear Index approaches maximum; US stocks may face another $80 billion sell-off next week

As the U.S. stock market faced a sharp sell-off on Friday, two major Wall Street market risk indicators issued warnings simultaneously.

智通财经•2026/11/20 23:42

Nvidia (NVDA.US) plunges 46% over seven weeks, marking the longest losing streak since the 2008 financial crisis, with its market capitalization evaporating by $2.6 trillion.

Nvidia is experiencing its longest consecutive weekly decline since the 2008 global financial crisis.

智通财经•2026/11/20 23:36

Overnight U.S. Stocks | Stocks, Gold, and Bitcoin Plunge Indiscriminately as VIX Fear Index Surges to 40, Nasdaq Wipes Out Year-to-Date Gains

At the close, the Dow Jones Industrial Average fell 949.73 points, or 1.93%, to 48,147.32 points; the S&P 500 index dropped 265.44 points, or 3.70%, to 6,910.39 points; and the Nasdaq declined 1,261.46 points, or 5.28%, to 22,617.73 points, down 2.7% year-to-date.

智通财经•2026/11/20 23:31

What happened? AI trading crash! Nasdaq drops over 5%, Anthropic IPO nearly breaks on the second day, Nvidia falls over 10%

Investors are not doubting the prospects of AI technology, but are beginning to question whether current valuations have fully priced in future growth. Anthropic's popularity does not prove the investment logic for the entire industry. Since Jensen Huang resigned as CEO, NVIDIA has experienced seven consecutive declines, falling nearly 28% in seven days. After Huang was investigated, news of a SEC accounting investigation added further pressure, causing its market value to evaporate by $2.65 trillion compared to the October peak. AMD closed down more than 10%, plunging for two consecutive days after a short-selling report, and the entire AI industry chain is undergoing widespread sell-off. The return on AI capital expenditure is being questioned, and the unwinding of crowded trades is amplifying the downward trend.

华尔街见闻•2026/11/20 23:26