
Solana is pushing toward a key resistance zone as traders watch whether the rebound can turn into something stronger. A move above $74.98 could open the way toward $80-$86, but failure there may send $SOL back toward support.
Solana Rally Faces Key Test Between $73 and $89
Solana is attempting a recovery from its June low, but the broader chart still shows a bearish corrective structure.
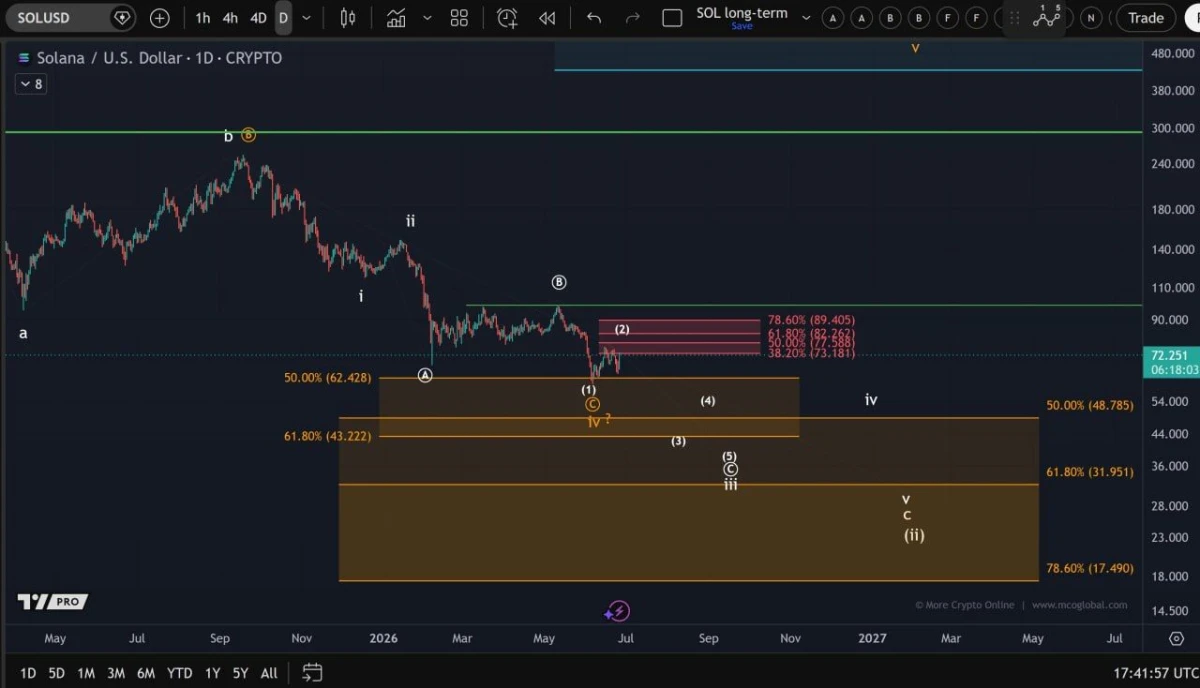
$SOL/USD Daily Chart. Source: @Morecryptoonl on X
The chart shows $SOL trading near $72.25 as it approaches the first major resistance zone between $73.18 and $89.40. This area could decide whether the current rebound continues or fails as another bear-market rally.
The preferred Elliott Wave count treats the move from the June low as a wave 2 bounce, meaning sellers could regain control if $SOL rejects from resistance. A break above the zone would improve the outlook, but it would not confirm a full trend reversal on its own.
For a stronger bullish case, Solana would need to break above resistance, form a clear five-wave advance and then hold a corrective pullback. Until that happens, the current rally remains at risk of fading.
Solana Faces $75 Test as Short-Term Rebound Builds
Solana is trading near $70.50 as buyers try to extend the rebound, but the next major test sits near $75.
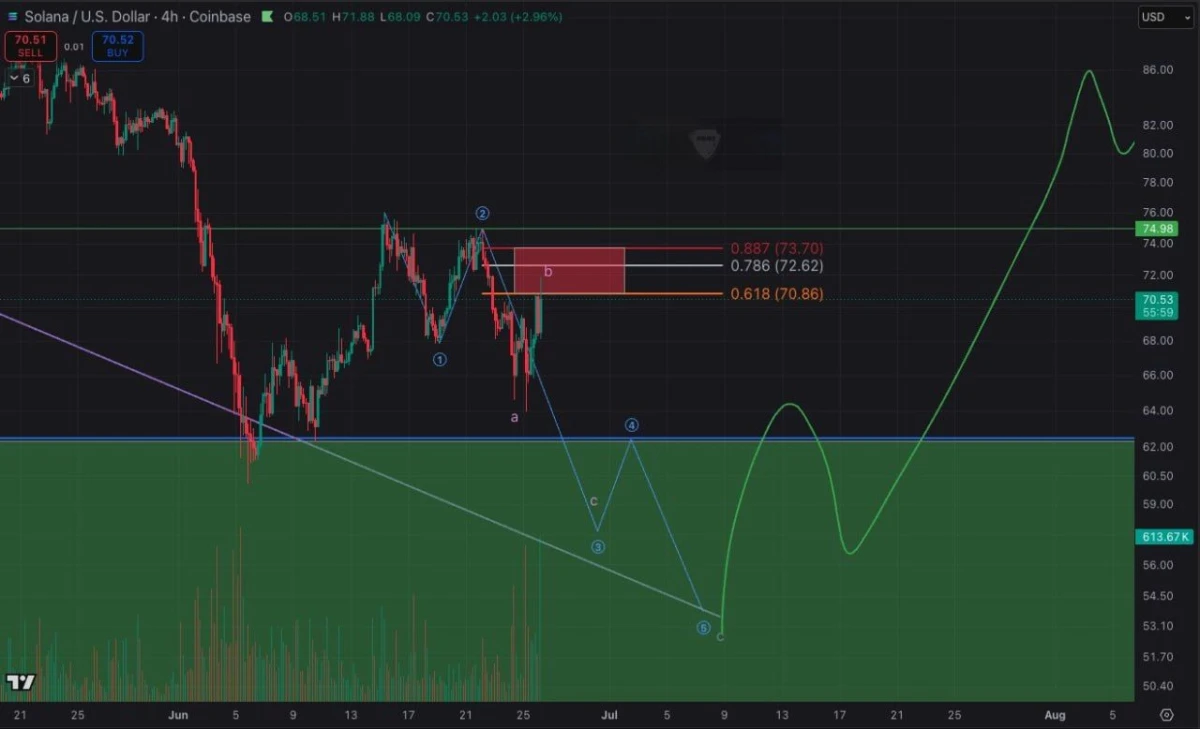
$SOL/USD 4-Hour Chart. Source: @Freedom_By_40 on X
The chart shows $SOL recovering from the early June sell-off and pushing into a short-term resistance zone between $70.86 and $73.70. A move above $74.98 would strengthen the bullish case and suggest that a faster recovery is underway.
However, the analyst’s base scenario still allows for another pullback before a larger move higher. The chart highlights a possible drop back toward the $62 support area, with deeper risk near $53 if sellers regain control.
If $SOL clears $74.98 and holds above it, the bearish pullback setup would weaken. That could open the way toward the $80-$86 range in early August.