
A Chart of Commodity Support and Resistance: Gold, Silver, Oil, Gas + Platinum, Palladium, Copper, Agricultural Futures (June 30, 2026)

FX678 June 30—— A single chart visualizing commodity support and resistance: gold, silver, oil, gas, platinum, palladium, copper, and agricultural futures, updated on Tuesday, June 30, 2026, 07:00 (UTC+8). Specifically covering 14 varieties including gold, silver, platinum, palladium, copper, crude oil, natural gas, fuel oil, wheat, corn, and cotton. For more details, refer to the FX678's custom chart.
A chart visualizing commodity support and resistance: gold, silver, oil, gas, platinum, palladium, copper, and agricultural futures, updated on Tuesday, June 30, 2026, 07:00 (UTC+8). Specifically covering 14 varieties including gold, silver, platinum, palladium, copper, crude oil, natural gas, fuel oil, wheat, corn, and cotton. For more details, see the content in the specially-made FX678 chart.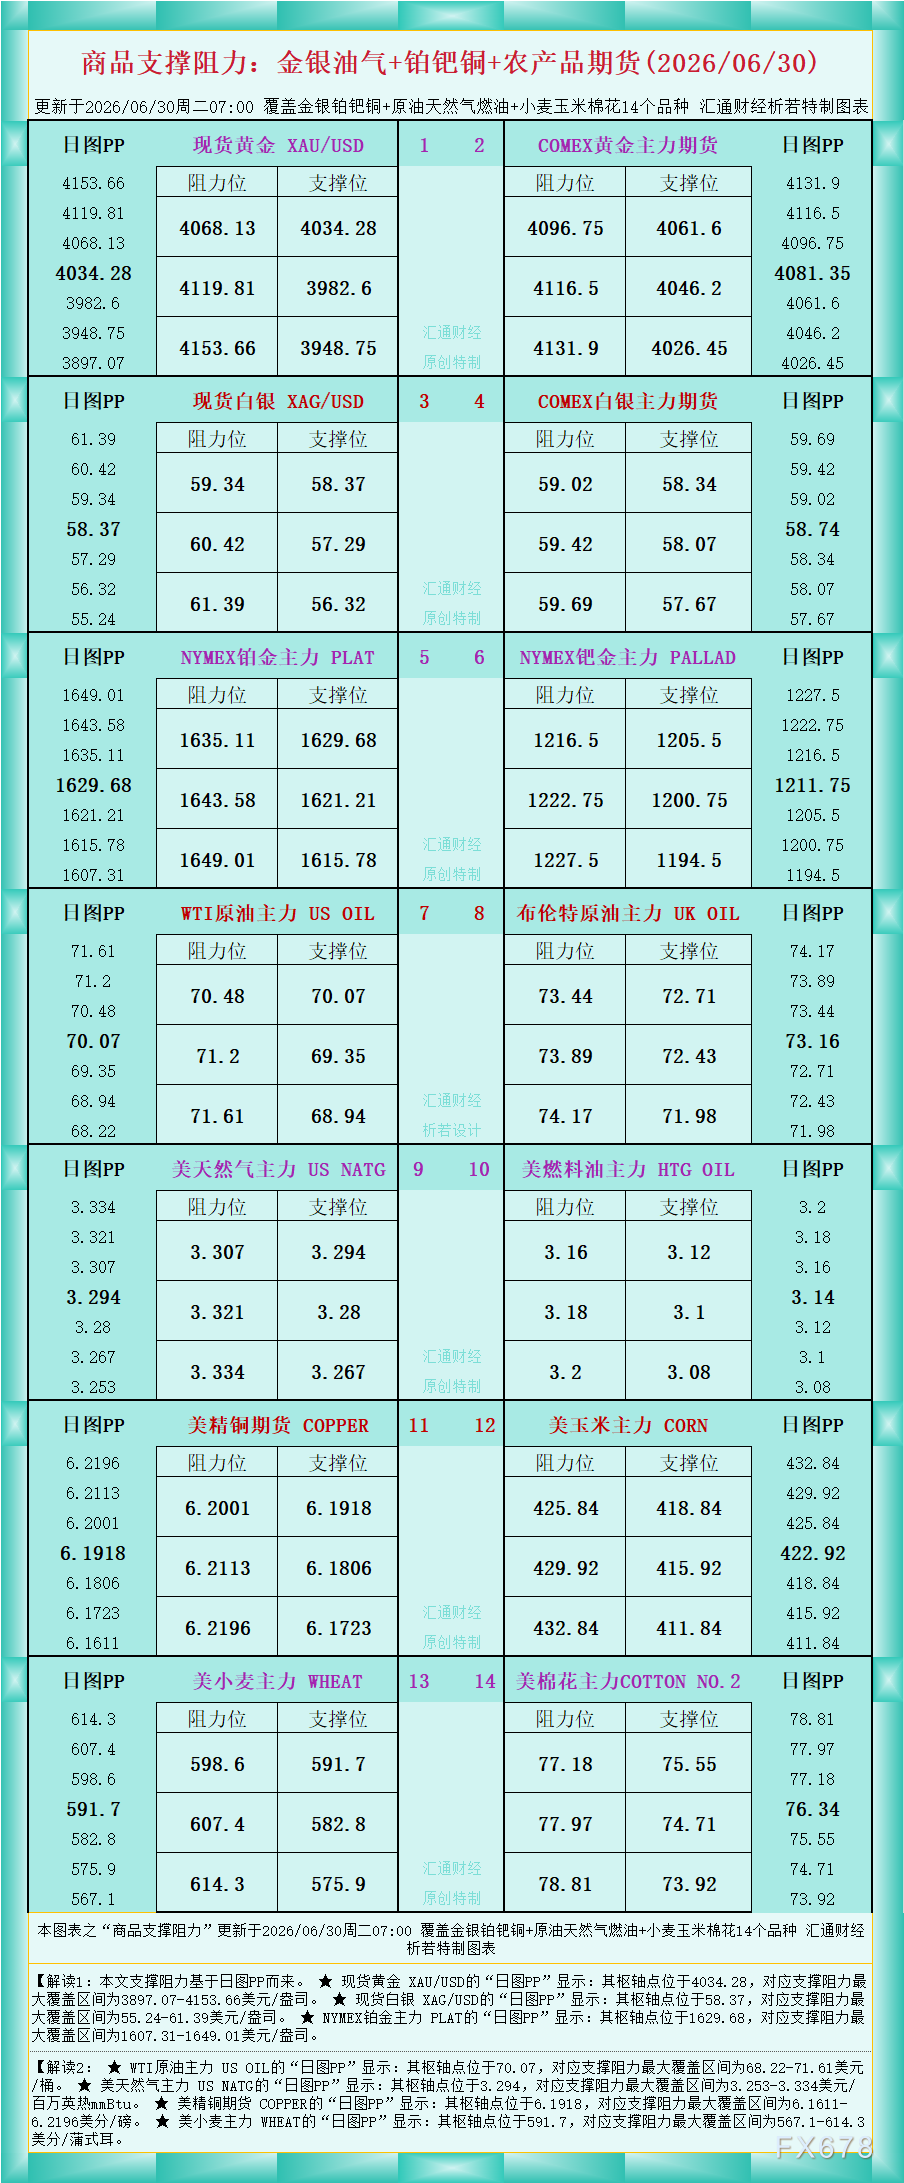
As shown in the figure, Interpretation 1: The support and resistance levels in this article are based on the daily chart pivot points (PP).
★ For spot gold XAU/USD, the “Daily Chart PP” shows: the pivot point is at 4034.28, with the maximum support and resistance range covering $3897.07-$4153.66/oz.
★ For spot silver XAG/USD, the “Daily Chart PP” shows: the pivot point is at 58.37, with the maximum support and resistance range covering $55.24-$61.39/oz.
★ For NYMEX platinum main contract PLAT, the “Daily Chart PP” shows: the pivot point is at 1629.68, with the maximum support and resistance range covering $1607.31-$1649.01/oz.
Interpretation 2:
★ For WTI Crude Oil main contract US OIL, the “Daily Chart PP” shows: the pivot point is at 70.07, with the maximum support and resistance range covering $68.22-$71.61/barrel.
★ For US natural gas main contract US NATG, the “Daily Chart PP” shows: the pivot point is at 3.294, with the maximum support and resistance range covering $3.253-$3.334/MMBtu.
★ For US copper futures COPPER, the “Daily Chart PP” shows: the pivot point is at 6.1918, with the maximum support and resistance range covering 6.1611-6.2196 cents/pound.
★ For US wheat main contract WHEAT, the “Daily Chart PP” shows: the pivot point is at 591.7, with the maximum support and resistance range covering 567.1-614.3 cents/bushel.
For more variety interpretations, refer to the chart. Produced originally and exclusively by FX678. All rights reserved.
Disclaimer: The content of this article solely reflects the author's opinion and does not represent the platform in any capacity. This article is not intended to serve as a reference for making investment decisions.
You may also like
As tech stocks fluctuate violently, hedge fund mogul warns: crowded "dispersion trades" may become a "magnifier" of market volatility
A hedge fund manager stated that dispersion trading is like a "time bomb"; if the market suddenly shifts, it will cause pain. Traditional dispersion trading involves betting that a basket of stocks or an index will remain stable, while individual stocks will have greater and more varied volatility. The hedge fund manager warned that if correlations between stocks increase, dispersion trading will become "very painful."

CoreWeave (CRWV.US) Q3 Conference Call: CEO Addresses High Debt Concerns, Says "Will Not Use the Unsecured Debt Market"; 75% of Committed Capital Expenditures Tied to Investment-grade Clients
AI cloud computing service provider CoreWeave held an earnings call after releasing its third-quarter 2026 results (as of September 30) following the close of trading on November 10, Eastern Time.
Micron plunges 22% in a week, is it a buying opportunity for memory chips? Bank of America bets on supercycle extending to 2028
The bullish forecasts by top Wall Street investment institutions such as Bank of America are underpinned by an AI training paradigm dominated by RSI, the expansion of AI agent applications focused on efficient AI inference processes, and the rising demand for HBM, server memory, and enterprise SSDs. Meanwhile, advanced manufacturing processes, capacity conversion, and yield ramp-up are restricting supply release, and long-term supply agreements are further improving sales visibility.

Crypto prices
More


